Estimated Value: $348,831 - $435,000
--
Bed
--
Bath
1,152
Sq Ft
$327/Sq Ft
Est. Value
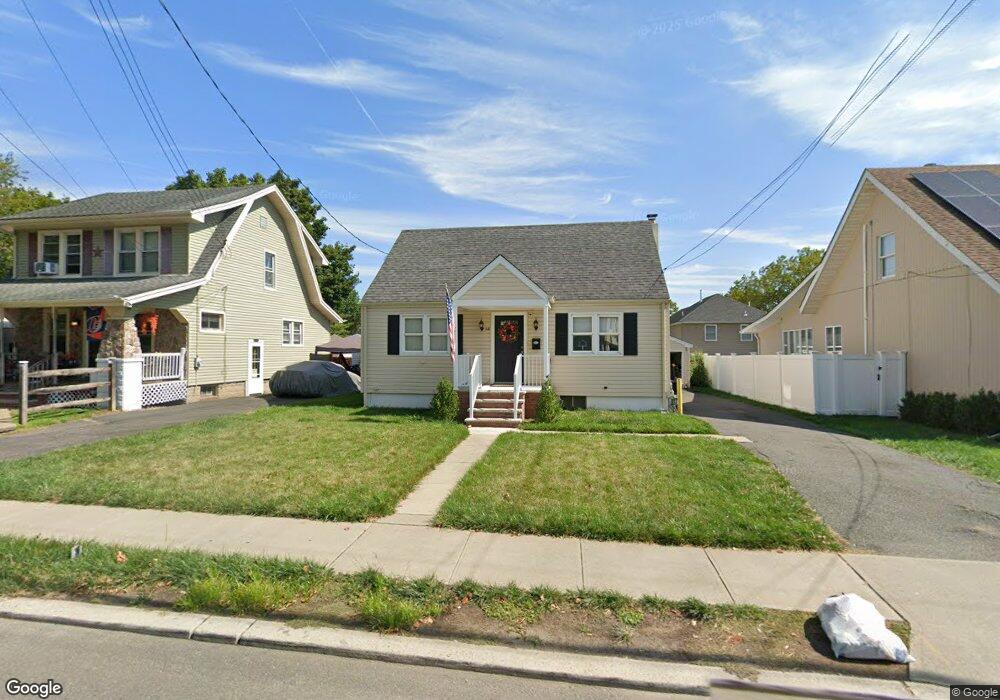
About This Home
This home is located at 58 S Salem St, Dover, NJ 07801 and is currently estimated at $376,708, approximately $327 per square foot. 58 S Salem St is a home located in Morris County with nearby schools including Dover Middle School and Dover High School.
Ownership History
Date
Name
Owned For
Owner Type
Purchase Details
Closed on
Mar 9, 2018
Sold by
Salem Street Limited Li
Bought by
Feliciano Carlos
Current Estimated Value
Home Financials for this Owner
Home Financials are based on the most recent Mortgage that was taken out on this home.
Original Mortgage
$174,775
Outstanding Balance
$149,304
Interest Rate
4.25%
Mortgage Type
FHA
Estimated Equity
$227,404
Purchase Details
Closed on
Feb 20, 2015
Sold by
Smith Anna M and Smith Anna
Bought by
Salem Street Llc
Create a Home Valuation Report for This Property
The Home Valuation Report is an in-depth analysis detailing your home's value as well as a comparison with similar homes in the area
Home Values in the Area
Average Home Value in this Area
Purchase History
| Date | Buyer | Sale Price | Title Company |
|---|---|---|---|
| Feliciano Carlos | $178,000 | None Available | |
| Salem Street Llc | -- | None Available |
Source: Public Records
Mortgage History
| Date | Status | Borrower | Loan Amount |
|---|---|---|---|
| Open | Feliciano Carlos | $174,775 |
Source: Public Records
Tax History Compared to Growth
Tax History
| Year | Tax Paid | Tax Assessment Tax Assessment Total Assessment is a certain percentage of the fair market value that is determined by local assessors to be the total taxable value of land and additions on the property. | Land | Improvement |
|---|---|---|---|---|
| 2025 | $5,803 | $177,300 | $75,300 | $102,000 |
| 2024 | $5,597 | $177,300 | $75,300 | $102,000 |
| 2023 | $5,597 | $177,300 | $75,300 | $102,000 |
| 2022 | $4,537 | $177,300 | $75,300 | $102,000 |
| 2021 | $4,537 | $156,300 | $75,300 | $81,000 |
| 2020 | $4,447 | $156,300 | $75,300 | $81,000 |
| 2019 | $4,262 | $156,300 | $75,300 | $81,000 |
| 2018 | $4,028 | $156,300 | $75,300 | $81,000 |
| 2017 | $3,845 | $156,300 | $75,300 | $81,000 |
| 2016 | $3,754 | $156,300 | $75,300 | $81,000 |
| 2015 | $3,288 | $160,000 | $127,500 | $32,500 |
| 2014 | $3,254 | $160,000 | $127,500 | $32,500 |
Source: Public Records
Map
Nearby Homes
- 1001 Wendover Ct
- 203 E Black Well St Abc Unit ABC
- 207 E Blackwell St
- 191 E Blackwell St Abcd
- 18 Perry St Ab Unit A&B
- 77B Highland Way
- 11 Cleveland Ave
- 22 S Highland Ave
- 130 King St
- 15 Summer Ave
- 301 E McFarlan St -A and B
- 215 Washington Ave
- 11 Millbrook Ave
- 33 Highland Ave
- 67 Elm St
- 12 Lincoln Ave
- 51 N Morris St
- 590 W Main St
- 121 W Munson Ave
- 108 Pequannock St A-B