Estimated Value: $709,008 - $761,000
2
Beds
2
Baths
1,460
Sq Ft
$504/Sq Ft
Est. Value
About This Home
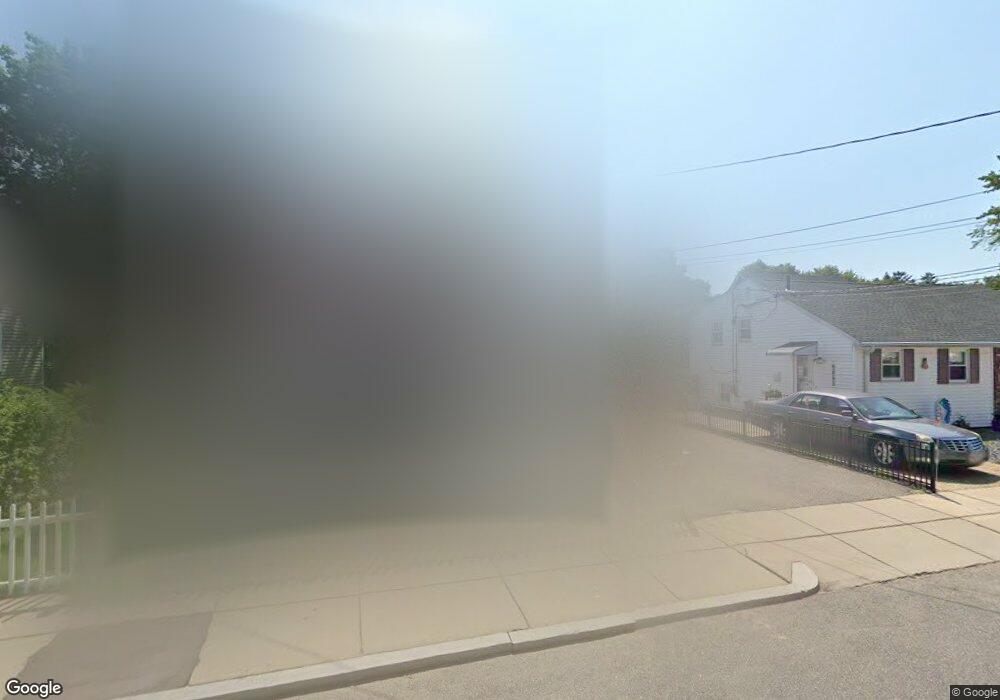
This home is located at 58 Salman St, West Roxbury, MA 02132 and is currently estimated at $736,002, approximately $504 per square foot. 58 Salman St is a home located in Suffolk County with nearby schools including St Theresa School, Catholic Memorial School, and The Roxbury Latin School.
Ownership History
Date
Name
Owned For
Owner Type
Purchase Details
Closed on
Nov 25, 2002
Sold by
Fahey Elena P
Bought by
Blake James M and Blake Lisa A
Current Estimated Value
Home Financials for this Owner
Home Financials are based on the most recent Mortgage that was taken out on this home.
Original Mortgage
$43,485
Outstanding Balance
$18,450
Interest Rate
6.07%
Mortgage Type
Purchase Money Mortgage
Estimated Equity
$717,552
Create a Home Valuation Report for This Property
The Home Valuation Report is an in-depth analysis detailing your home's value as well as a comparison with similar homes in the area
Home Values in the Area
Average Home Value in this Area
Purchase History
| Date | Buyer | Sale Price | Title Company |
|---|---|---|---|
| Blake James M | $56,650 | -- |
Source: Public Records
Mortgage History
| Date | Status | Borrower | Loan Amount |
|---|---|---|---|
| Open | Blake James M | $43,485 |
Source: Public Records
Tax History Compared to Growth
Tax History
| Year | Tax Paid | Tax Assessment Tax Assessment Total Assessment is a certain percentage of the fair market value that is determined by local assessors to be the total taxable value of land and additions on the property. | Land | Improvement |
|---|---|---|---|---|
| 2025 | $6,817 | $588,700 | $167,300 | $421,400 |
| 2024 | $6,095 | $559,200 | $175,900 | $383,300 |
| 2023 | $6,006 | $559,200 | $175,900 | $383,300 |
| 2022 | $5,531 | $508,400 | $159,900 | $348,500 |
| 2021 | $4,976 | $466,400 | $152,300 | $314,100 |
| 2020 | $4,693 | $444,400 | $132,800 | $311,600 |
| 2019 | $4,416 | $419,000 | $109,600 | $309,400 |
| 2018 | $4,065 | $387,900 | $109,600 | $278,300 |
| 2017 | $4,066 | $383,900 | $109,600 | $274,300 |
| 2016 | $3,983 | $362,100 | $109,600 | $252,500 |
| 2015 | $4,086 | $337,400 | $125,300 | $212,100 |
| 2014 | $3,966 | $315,300 | $125,300 | $190,000 |
Source: Public Records
Map
Nearby Homes
- 110 New Haven St
- 191 Glenellen Rd
- 199 Glenellen Rd
- 55 Cottage Rd
- 115 Grove St Unit 11
- 111 Grove St Unit 6
- 150 Grove St
- 80 Caledonian Ave
- 1515 Vfw Pkwy Unit M19
- 5245 Washington St Unit 5
- 11 Cheriton Rd Unit 102B
- 12 Bronx Rd
- 25R Rockland St Unit 6
- 14 Arbor Ln
- 2231 Centre St
- 63 Johnson St
- 45 Weymouth Ave
- 57 Rockland St
- 70 Birchwood St
- 235 Curve St