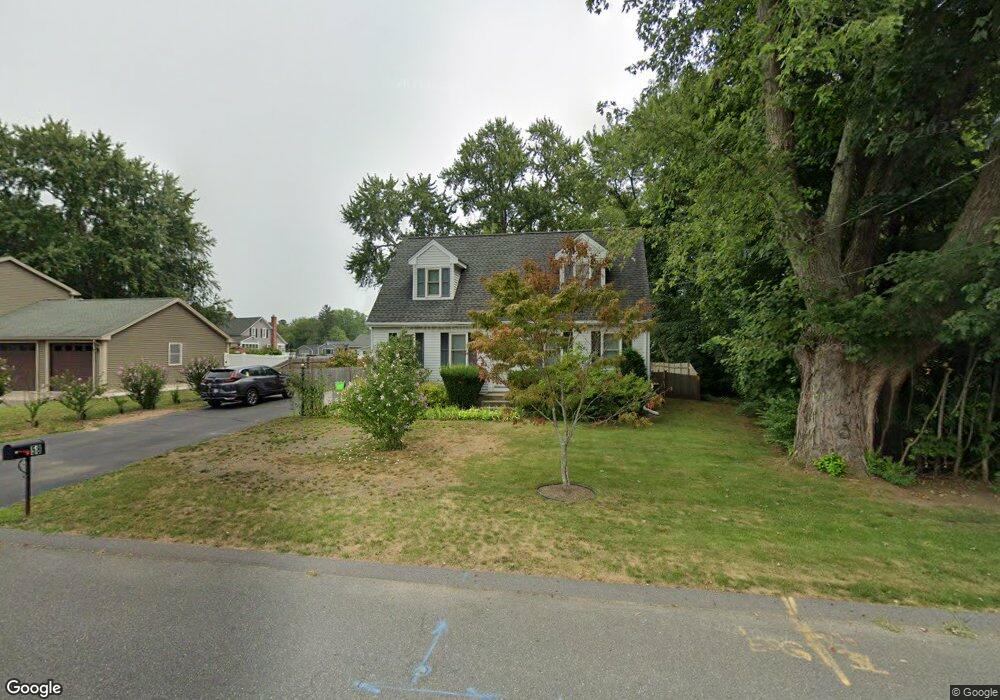
58 Simonds St Ludlow, MA 01056
Estimated Value: $317,000 - $422,000
1
Bed
1
Bath
1,650
Sq Ft
$237/Sq Ft
Est. Value
About This Home
This home is located at 58 Simonds St, Ludlow, MA 01056 and is currently estimated at $390,284, approximately $236 per square foot. 58 Simonds St is a home located in Hampden County with nearby schools including East Street Elementary School, Chapin Street Elementary School, and Paul R. Baird Middle School.
Ownership History
Date
Name
Owned For
Owner Type
Purchase Details
Closed on
May 20, 1997
Sold by
Fontaine Maureen L and Connelly Patricia L
Bought by
Manganaro Home Bldrs
Current Estimated Value
Home Financials for this Owner
Home Financials are based on the most recent Mortgage that was taken out on this home.
Original Mortgage
$52,016
Interest Rate
8.12%
Mortgage Type
Purchase Money Mortgage
Create a Home Valuation Report for This Property
The Home Valuation Report is an in-depth analysis detailing your home's value as well as a comparison with similar homes in the area
Home Values in the Area
Average Home Value in this Area
Purchase History
| Date | Buyer | Sale Price | Title Company |
|---|---|---|---|
| Manganaro Home Bldrs | $25,000 | -- | |
| Manganaro Home Bldrs | $25,000 | -- | |
| Manganaro Home Bldrs | $25,000 | -- |
Source: Public Records
Mortgage History
| Date | Status | Borrower | Loan Amount |
|---|---|---|---|
| Open | Manganaro Home Bldrs | $88,500 | |
| Closed | Manganaro Home Bldrs | $15,000 | |
| Closed | Manganaro Home Bldrs | $52,016 |
Source: Public Records
Tax History
| Year | Tax Paid | Tax Assessment Tax Assessment Total Assessment is a certain percentage of the fair market value that is determined by local assessors to be the total taxable value of land and additions on the property. | Land | Improvement |
|---|---|---|---|---|
| 2025 | $6,322 | $364,400 | $85,800 | $278,600 |
| 2024 | $6,038 | $333,800 | $85,700 | $248,100 |
| 2023 | $5,763 | $295,400 | $78,500 | $216,900 |
| 2022 | $5,129 | $256,600 | $72,000 | $184,600 |
| 2021 | $5,154 | $244,500 | $72,000 | $172,500 |
| 2020 | $4,936 | $239,400 | $70,900 | $168,500 |
| 2019 | $4,644 | $234,300 | $70,200 | $164,100 |
| 2018 | $4,338 | $228,200 | $70,200 | $158,000 |
| 2017 | $4,136 | $223,200 | $68,800 | $154,400 |
| 2016 | $3,969 | $218,900 | $67,400 | $151,500 |
| 2015 | $3,740 | $216,300 | $66,700 | $149,600 |
Source: Public Records
Map
Nearby Homes
- 57 Belmont St
- 0 Fuller St Unit 73409741
- 70 Fuller St
- 119 Blisswood Village Dr
- 42 Loopley St
- 382 Holyoke St
- 0 N S Main St Io
- 295 Main St
- 102 Swan Ave
- 201 Main St
- 166-168 Main St
- 26 Swan Ave
- 50 Warsaw Ave
- 59 Pinevale St
- 47 Kendall St
- 42 Roy St
- 96 Lyons St
- 15 Hilltop Terrace
- 0 Center St Unit 73415933
- 184 Howard St
Your Personal Tour Guide
Ask me questions while you tour the home.