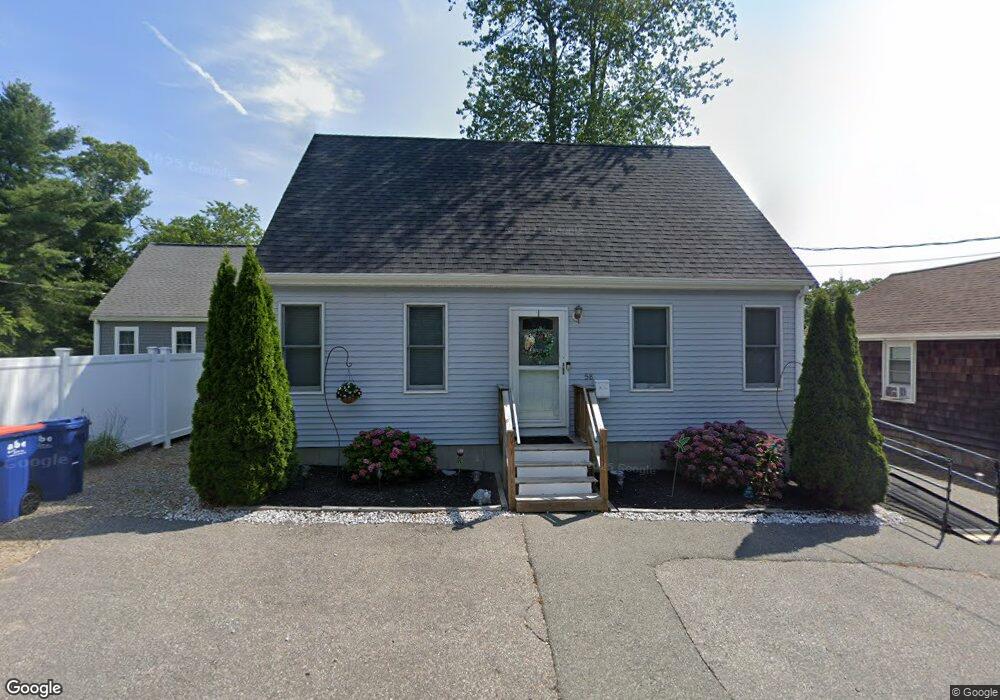
58 Warr Ave Wareham, MA 02571
Wareham Center NeighborhoodEstimated Value: $497,000 - $629,000
3
Beds
2
Baths
1,408
Sq Ft
$382/Sq Ft
Est. Value
About This Home
This home is located at 58 Warr Ave, Wareham, MA 02571 and is currently estimated at $537,612, approximately $381 per square foot. 58 Warr Ave is a home located in Plymouth County.
Ownership History
Date
Name
Owned For
Owner Type
Purchase Details
Closed on
Mar 31, 2006
Sold by
Jones James E and Jones Penny L
Bought by
Damata Sally J
Current Estimated Value
Purchase Details
Closed on
May 14, 2004
Sold by
Reed Michael W
Bought by
Jones James E and Jones Penny L
Purchase Details
Closed on
Sep 16, 2003
Sold by
Baker Keith A
Bought by
Reed Michael W
Purchase Details
Closed on
Mar 13, 2001
Sold by
Bedore Dorothy E
Bought by
Bedore Peter L
Create a Home Valuation Report for This Property
The Home Valuation Report is an in-depth analysis detailing your home's value as well as a comparison with similar homes in the area
Home Values in the Area
Average Home Value in this Area
Purchase History
| Date | Buyer | Sale Price | Title Company |
|---|---|---|---|
| Damata Sally J | $286,000 | -- | |
| Damata Sally J | $286,000 | -- | |
| Jones James E | $125,000 | -- | |
| Jones James E | $125,000 | -- | |
| Reed Michael W | $50,000 | -- | |
| Reed Michael W | $50,000 | -- | |
| Bedore Peter L | $17,000 | -- | |
| Bedore Peter L | $17,000 | -- |
Source: Public Records
Mortgage History
| Date | Status | Borrower | Loan Amount |
|---|---|---|---|
| Open | Bedore Peter L | $266,107 | |
| Closed | Bedore Peter L | $263,121 |
Source: Public Records
Tax History
| Year | Tax Paid | Tax Assessment Tax Assessment Total Assessment is a certain percentage of the fair market value that is determined by local assessors to be the total taxable value of land and additions on the property. | Land | Improvement |
|---|---|---|---|---|
| 2025 | $4,247 | $407,600 | $102,900 | $304,700 |
| 2024 | $4,406 | $392,300 | $75,900 | $316,400 |
| 2023 | $3,797 | $347,100 | $69,000 | $278,100 |
| 2022 | $3,797 | $288,100 | $69,000 | $219,100 |
| 2021 | $3,734 | $277,600 | $69,000 | $208,600 |
| 2020 | $3,543 | $267,200 | $69,000 | $198,200 |
| 2019 | $3,315 | $249,400 | $56,000 | $193,400 |
| 2018 | $3,016 | $221,300 | $56,000 | $165,300 |
| 2017 | $2,928 | $217,700 | $56,000 | $161,700 |
| 2016 | $2,676 | $197,800 | $52,700 | $145,100 |
| 2015 | $2,585 | $197,800 | $52,700 | $145,100 |
| 2014 | $2,366 | $184,100 | $50,100 | $134,000 |
Source: Public Records
Map
Nearby Homes
- 1 Nimrod Way
- 10 Oak St
- 15 Broadmarsh Ave
- 6 Allen Ave
- 20 Grant St
- 43 Shore Ave
- 12 Oakdale St
- 6 Wildwood Ave
- 21 Bayview St
- 10 Barnes St
- 10 Longmeadow Dr
- 6 Bourne Terrace
- 110 Mayflower Ridge Dr
- 437 Main St
- 58 Shady Ln
- 233 Marion Rd
- 156 Sandwich Rd
- 2697 Cranberry Hwy Unit 21
- 2645 Cranberry Hwy Unit A
- 2743 Cranberry Hwy Unit 5D
Your Personal Tour Guide
Ask me questions while you tour the home.