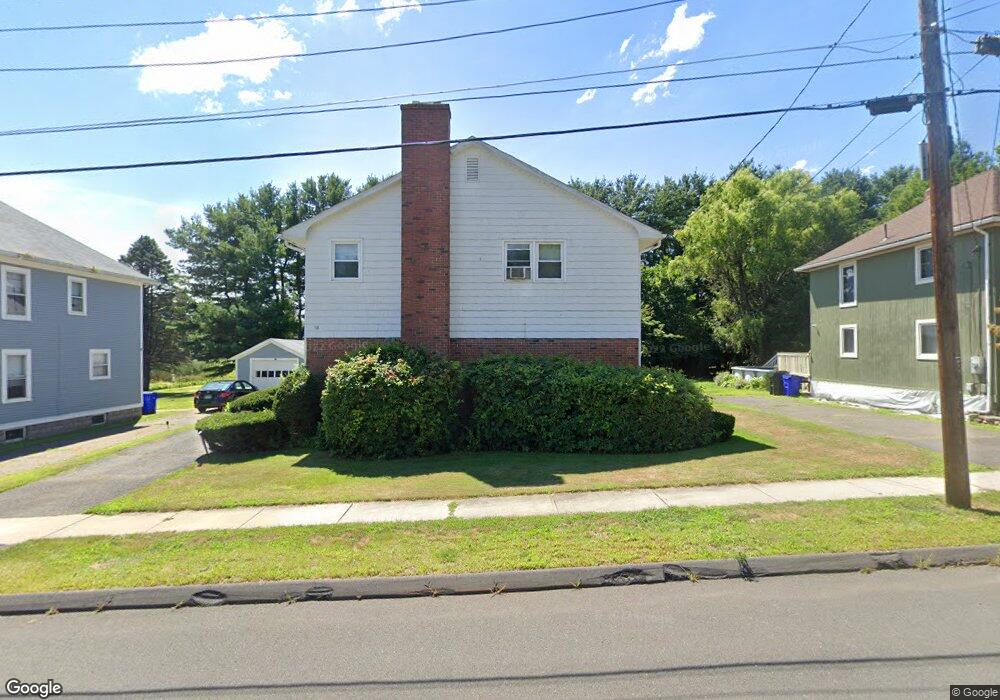
58 Whiton St Windsor Locks, CT 06096
Estimated Value: $381,125 - $418,000
4
Beds
3
Baths
2,546
Sq Ft
$156/Sq Ft
Est. Value
About This Home
This home is located at 58 Whiton St, Windsor Locks, CT 06096 and is currently estimated at $397,781, approximately $156 per square foot. 58 Whiton St is a home located in Hartford County with nearby schools including North Street School, South Elementary School, and Windsor Locks Middle School.
Ownership History
Date
Name
Owned For
Owner Type
Purchase Details
Closed on
Sep 12, 2023
Sold by
Mundle Janet V
Bought by
Mundle Janet V and Mundle Kipling O
Current Estimated Value
Purchase Details
Closed on
Jun 22, 2010
Sold by
Morell Sonia and Doak Clair
Bought by
Mundle Janet
Home Financials for this Owner
Home Financials are based on the most recent Mortgage that was taken out on this home.
Original Mortgage
$212,143
Interest Rate
5.03%
Mortgage Type
Purchase Money Mortgage
Create a Home Valuation Report for This Property
The Home Valuation Report is an in-depth analysis detailing your home's value as well as a comparison with similar homes in the area
Home Values in the Area
Average Home Value in this Area
Purchase History
| Date | Buyer | Sale Price | Title Company |
|---|---|---|---|
| Mundle Janet V | -- | None Available | |
| Mundle Janet | $215,000 | -- |
Source: Public Records
Mortgage History
| Date | Status | Borrower | Loan Amount |
|---|---|---|---|
| Previous Owner | Mundle Janet | $212,143 |
Source: Public Records
Tax History Compared to Growth
Tax History
| Year | Tax Paid | Tax Assessment Tax Assessment Total Assessment is a certain percentage of the fair market value that is determined by local assessors to be the total taxable value of land and additions on the property. | Land | Improvement |
|---|---|---|---|---|
| 2025 | $5,935 | $247,380 | $50,680 | $196,700 |
| 2024 | $4,003 | $142,240 | $32,760 | $109,480 |
| 2023 | $3,745 | $142,240 | $32,760 | $109,480 |
| 2022 | $3,674 | $142,240 | $32,760 | $109,480 |
| 2021 | $3,674 | $142,240 | $32,760 | $109,480 |
| 2020 | $3,674 | $142,240 | $32,760 | $109,480 |
| 2019 | $3,674 | $142,240 | $32,760 | $109,480 |
| 2017 | $4,042 | $151,600 | $31,900 | $119,700 |
| 2016 | $4,042 | $151,600 | $31,900 | $119,700 |
| 2015 | $4,061 | $151,600 | $31,900 | $119,700 |
| 2014 | $4,089 | $155,900 | $36,200 | $119,700 |
Source: Public Records
Map
Nearby Homes