
Seller's Agent in 2025
Zachary Ferrell
Keller Williams Advisors
(937) 430-5550
2 in this area
349 Total Sales
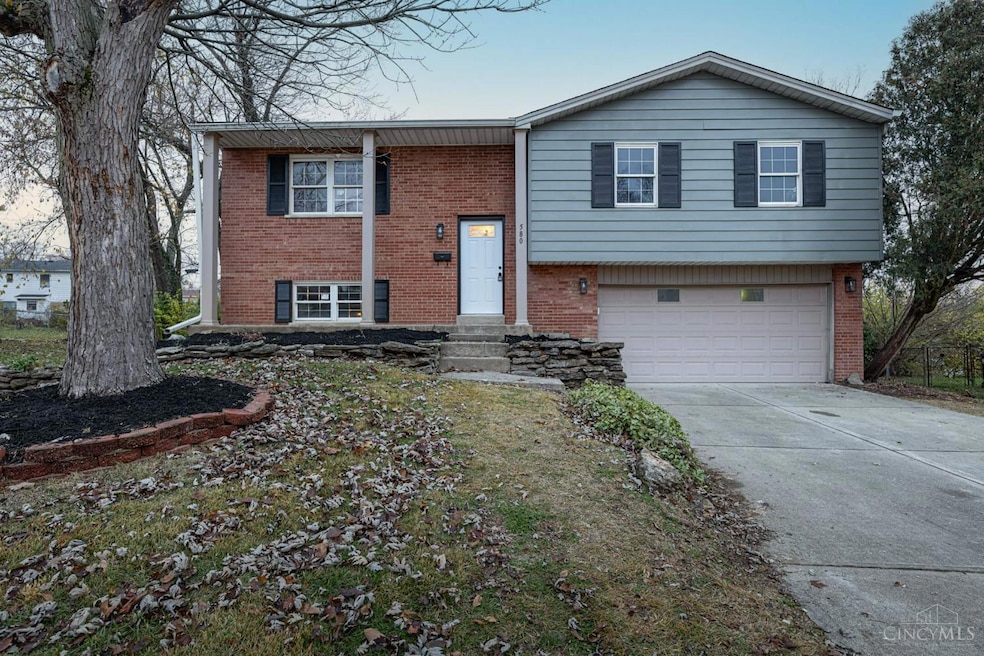
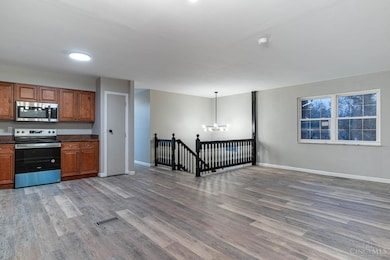
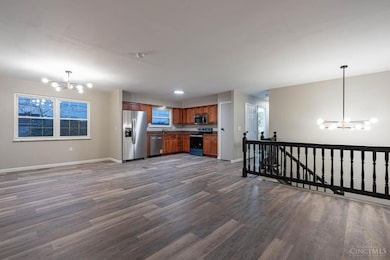
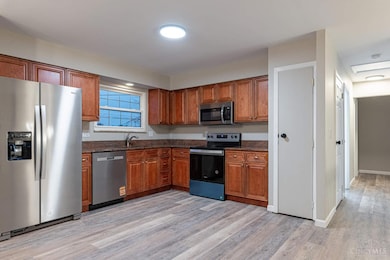
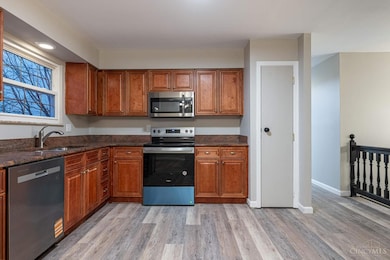
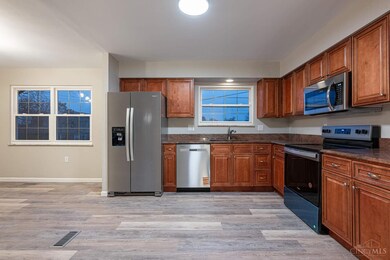
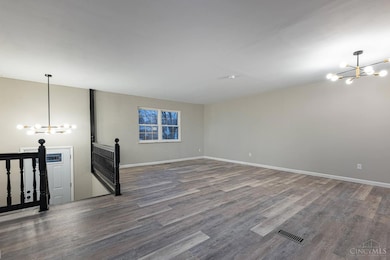
Brand new furnace, a/c, LVP, Carpet, SS Appliances, exterior paint, interior paint, lighting and much more! Fenced in backyard w/stone patio. Finished lower level with family room w/walkout, laundry, full bath and 4th bedroom, oversized 2 car attached garage, master bedroom with attached full bath, and located in quiet cul de sac!
Last Agent to Sell the Property
Keller Williams Advisors License #2013000980 Listed on: 11/21/2025
| Date | Type | Sale Price | Title Company |
|---|---|---|---|
| Warranty Deed | $283,000 | American Homeland Title (Ahta) | |
| Warranty Deed | $178,000 | None Listed On Document | |
| Warranty Deed | $178,000 | None Listed On Document |
| Date | Status | Loan Amount | Loan Type |
|---|---|---|---|
| Open | $277,874 | Credit Line Revolving |
| Date | Event | Price | List to Sale | Price per Sq Ft |
|---|---|---|---|---|
| 12/23/2025 12/23/25 | Sold | $283,000 | +1.1% | $167 / Sq Ft |
| 11/26/2025 11/26/25 | Pending | -- | -- | -- |
| 11/21/2025 11/21/25 | For Sale | $279,900 | -- | $165 / Sq Ft |
| Year | Tax Paid | Tax Assessment Tax Assessment Total Assessment is a certain percentage of the fair market value that is determined by local assessors to be the total taxable value of land and additions on the property. | Land | Improvement |
|---|---|---|---|---|
| 2025 | $2,751 | $56,949 | $9,072 | $47,877 |
| 2024 | $2,681 | $56,949 | $9,072 | $47,877 |
| 2023 | $2,767 | $56,949 | $9,072 | $47,877 |
| 2022 | $2,483 | $41,213 | $8,068 | $33,145 |
| 2021 | $2,411 | $41,213 | $8,068 | $33,145 |
| 2020 | $2,460 | $41,213 | $8,068 | $33,145 |
| 2019 | $2,203 | $34,346 | $6,724 | $27,622 |
| 2018 | $2,208 | $34,346 | $6,724 | $27,622 |
| 2017 | $2,116 | $34,346 | $6,724 | $27,622 |
| 2016 | $1,959 | $32,089 | $7,095 | $24,994 |
| 2015 | $1,826 | $32,089 | $7,095 | $24,994 |
| 2014 | $1,686 | $32,089 | $7,095 | $24,994 |
| 2013 | $1,773 | $33,779 | $7,469 | $26,310 |
Seller's Agent in 2025
Zachary Ferrell
Keller Williams Advisors
(937) 430-5550
2 in this area
349 Total Sales
Seller Co-Listing Agent in 2025
Spencer Ferrell
Keller Williams Advisors
(513) 874-3300
1 in this area
307 Total Sales
Buyer's Agent in 2025
Flor Orellana-Diaz
Keller Williams Advisors
(513) 866-3636
32 in this area
490 Total Sales
Source: MLS of Greater Cincinnati (CincyMLS)
MLS Number: 1862661
APN: 591-0003-0224
Disclaimer: Certain information contained herein is derived from information provided by parties other than Homes.com. All information provided is deemed reliable, but is not guaranteed to be accurate and should be independently verified.
![]() The data relating to real estate for sale on this website comes in part from the Broker Reciprocity programs of the MLS of Greater Cincinnati, Inc.. Those listings held by brokerage firms other than Ten-X are marked with the Broker Reciprocity logo and house icon. The properties displayed may not be all of the properties available through Broker Reciprocity.
The data relating to real estate for sale on this website comes in part from the Broker Reciprocity programs of the MLS of Greater Cincinnati, Inc.. Those listings held by brokerage firms other than Ten-X are marked with the Broker Reciprocity logo and house icon. The properties displayed may not be all of the properties available through Broker Reciprocity.
IDX information is provided exclusively for personal, non-commercial use, and may not be used for any purpose other than to identify prospective properties consumers may be interested in purchasing.
Information is deemed reliable but not guaranteed.
Ten-X does not display the entire Cincinnati MLS Broker Reciprocity™ database on this web site. The listings of some real estate brokerage firms have been excluded.
Copyright 2026, MLS of Greater Cincinnati, Inc. All rights reserved
Ask me questions while you tour the home.