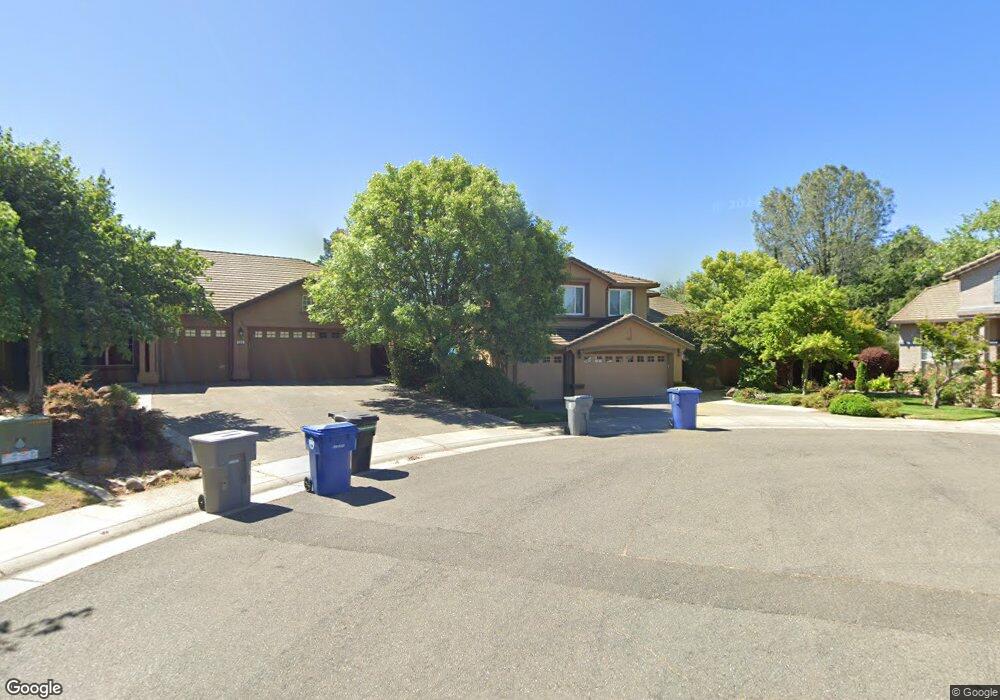
580 Borges Ct Folsom, CA 95630
Prairie Oaks NeighborhoodEstimated Value: $983,000 - $1,105,000
4
Beds
3
Baths
3,154
Sq Ft
$327/Sq Ft
Est. Value
About This Home
This home is located at 580 Borges Ct, Folsom, CA 95630 and is currently estimated at $1,032,443, approximately $327 per square foot. 580 Borges Ct is a home located in Sacramento County with nearby schools including Sandra J. Gallardo Elementary School, Sutter Middle School, and Folsom High School.
Ownership History
Date
Name
Owned For
Owner Type
Purchase Details
Closed on
Feb 23, 2016
Sold by
Ahnell David W and Ahnell Nanette M
Bought by
The David & Nanette Ahnell Living Trust
Current Estimated Value
Purchase Details
Closed on
Mar 8, 2004
Sold by
Norville Patrick Leland and Norville Stefani Lyn
Bought by
Ahnell David W and Ahnell Nanette M
Home Financials for this Owner
Home Financials are based on the most recent Mortgage that was taken out on this home.
Original Mortgage
$416,000
Outstanding Balance
$194,692
Interest Rate
5.69%
Mortgage Type
Purchase Money Mortgage
Estimated Equity
$837,751
Purchase Details
Closed on
Nov 15, 1999
Sold by
Lennar Renaissance Inc
Bought by
Norville Patrick Leland and Norville Stefani Lyn
Create a Home Valuation Report for This Property
The Home Valuation Report is an in-depth analysis detailing your home's value as well as a comparison with similar homes in the area
Home Values in the Area
Average Home Value in this Area
Purchase History
| Date | Buyer | Sale Price | Title Company |
|---|---|---|---|
| The David & Nanette Ahnell Living Trust | -- | None Available | |
| Ahnell David W | $595,000 | Chicago Title Co | |
| Norville Patrick Leland | $330,500 | North American Title Guarant |
Source: Public Records
Mortgage History
| Date | Status | Borrower | Loan Amount |
|---|---|---|---|
| Open | Ahnell David W | $416,000 |
Source: Public Records
Tax History
| Year | Tax Paid | Tax Assessment Tax Assessment Total Assessment is a certain percentage of the fair market value that is determined by local assessors to be the total taxable value of land and additions on the property. | Land | Improvement |
|---|---|---|---|---|
| 2025 | $9,517 | $845,949 | $156,388 | $689,561 |
| 2024 | $9,517 | $829,363 | $153,322 | $676,041 |
| 2023 | $9,347 | $813,102 | $150,316 | $662,786 |
| 2022 | $9,198 | $797,160 | $147,369 | $649,791 |
| 2021 | $9,081 | $781,530 | $144,480 | $637,050 |
| 2020 | $8,661 | $773,517 | $142,999 | $630,518 |
| 2019 | $8,519 | $758,351 | $140,196 | $618,155 |
| 2018 | $8,311 | $743,483 | $137,448 | $606,035 |
| 2017 | $9,612 | $728,905 | $134,753 | $594,152 |
| 2016 | $9,964 | $714,613 | $132,111 | $582,502 |
| 2015 | $9,626 | $703,880 | $130,127 | $573,753 |
| 2014 | $9,205 | $690,092 | $127,578 | $562,514 |
Source: Public Records
Map
Nearby Homes
- 611 Rogers Cir
- 939 Mcguire Ct
- 968 Carter St
- 104 Hesser Ct
- 112 Hazelmere Dr
- 433 Ellis Cir
- 632 Fisher Cir
- 692 Humbert St
- 683 Loomis Cir
- 701 Ferrier Way
- 743 Moylegrove Ct
- 894 Blossom Rock Ln
- 757 Hatherden Ct
- 108 Austin Dr
- 931 Willow Bridge Dr
- 753 Rodmartin Ct
- 2702 Ferry Cir Unit 102
- 145 Hopfield Dr
- 300 Sprig Cir
- 136 Penaranda Dr
Your Personal Tour Guide
Ask me questions while you tour the home.