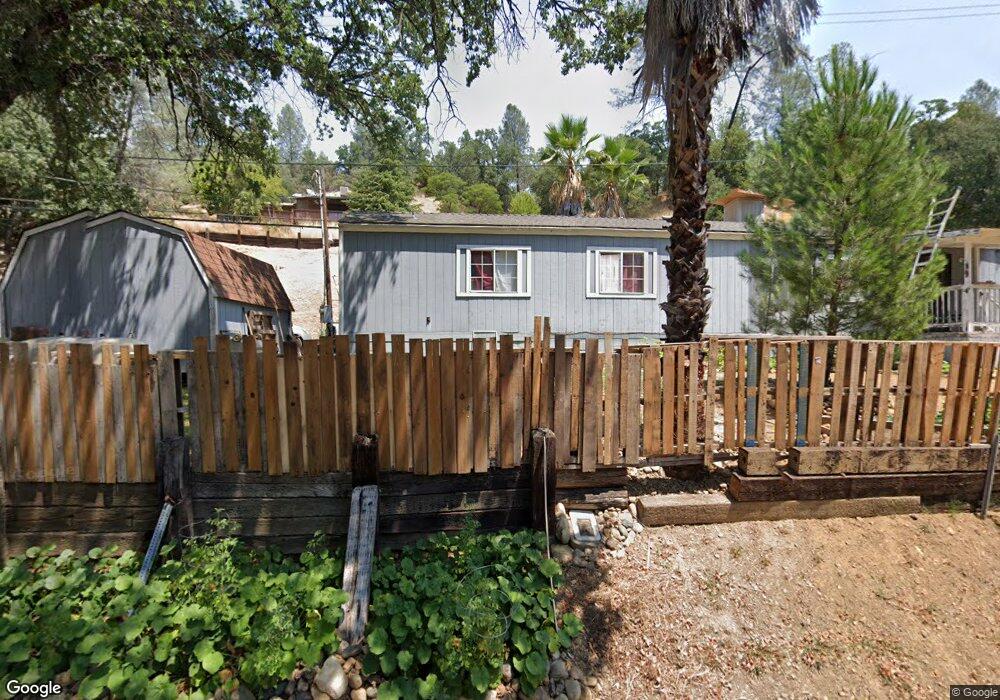
580 Branstetter Ln Redding, CA 96001
Branstetter NeighborhoodEstimated Value: $237,000 - $257,000
2
Beds
1
Bath
990
Sq Ft
$247/Sq Ft
Est. Value
About This Home
This home is located at 580 Branstetter Ln, Redding, CA 96001 and is currently estimated at $245,004, approximately $247 per square foot. 580 Branstetter Ln is a home located in Shasta County with nearby schools including Sycamore Elementary School, Sequoia Middle School, and Shasta High School.
Ownership History
Date
Name
Owned For
Owner Type
Purchase Details
Closed on
Sep 4, 2025
Sold by
Mathews Family Revocable Trust and Mathews Marvin D
Bought by
Walker Brittni C
Current Estimated Value
Home Financials for this Owner
Home Financials are based on the most recent Mortgage that was taken out on this home.
Original Mortgage
$225,000
Outstanding Balance
$225,000
Interest Rate
6.74%
Mortgage Type
New Conventional
Estimated Equity
$20,004
Purchase Details
Closed on
Dec 19, 2019
Sold by
Mathews Marvin D and Mathews Jacqueline M
Bought by
Mathews Marvin D and Mathews Jacqueline M
Home Financials for this Owner
Home Financials are based on the most recent Mortgage that was taken out on this home.
Original Mortgage
$76,000
Interest Rate
3.7%
Mortgage Type
New Conventional
Purchase Details
Closed on
Apr 15, 2004
Sold by
Mathews Marvin D and Mathews Jacqueline M
Bought by
Mathews Marvin D and Mathews Jacqueline M
Create a Home Valuation Report for This Property
The Home Valuation Report is an in-depth analysis detailing your home's value as well as a comparison with similar homes in the area
Home Values in the Area
Average Home Value in this Area
Purchase History
| Date | Buyer | Sale Price | Title Company |
|---|---|---|---|
| Walker Brittni C | $250,000 | First American Title | |
| Mathews Marvin D | -- | Placer Title Company | |
| Mathews Marvin D | -- | -- |
Source: Public Records
Mortgage History
| Date | Status | Borrower | Loan Amount |
|---|---|---|---|
| Open | Walker Brittni C | $225,000 | |
| Previous Owner | Mathews Marvin D | $76,000 |
Source: Public Records
Tax History Compared to Growth
Tax History
| Year | Tax Paid | Tax Assessment Tax Assessment Total Assessment is a certain percentage of the fair market value that is determined by local assessors to be the total taxable value of land and additions on the property. | Land | Improvement |
|---|---|---|---|---|
| 2025 | $395 | $34,648 | $22,979 | $11,669 |
| 2024 | $389 | $33,970 | $22,529 | $11,441 |
| 2023 | $389 | $33,305 | $22,088 | $11,217 |
| 2022 | $382 | $32,653 | $21,655 | $10,998 |
| 2021 | $379 | $32,014 | $21,231 | $10,783 |
| 2020 | $383 | $31,687 | $21,014 | $10,673 |
| 2019 | $364 | $31,066 | $20,602 | $10,464 |
| 2018 | $367 | $30,458 | $20,199 | $10,259 |
| 2017 | $364 | $29,861 | $19,803 | $10,058 |
| 2016 | $353 | $29,276 | $19,415 | $9,861 |
| 2015 | $349 | $28,837 | $19,124 | $9,713 |
| 2014 | $346 | $28,273 | $18,750 | $9,523 |
Source: Public Records
Map
Nearby Homes
- 441 Branstetter Ln
- 762 Branstetter Ln
- 764 Branstetter Ln
- 4750 Enchanted Way
- 4410 Melody Ln
- 4125 Sunglow Dr
- 4200 Sunglow Dr
- 4235 Sunglow Dr
- 4175 Sunglow Dr
- 2794 Summerbreeze Place
- 4165 Sunglow Dr
- 2779 Summerbreeze Place
- 5750 Cedars Rd
- 5812 Cedars Rd Unit 36
- 5812 Cedars Rd Unit 3
- 4368 Wild Flower Way
- 4105 Winter Green Ct
- 4378 Nightbird Way
- 4338 Blazingwood Dr
- 000 Weseman Rd
- 542 Branstetter Ln
- 575 Branstetter Ln
- 530 Branstetter Ln
- 670 Branstetter Ln
- 543 Branstetter Ln
- 520 Branstetter Ln
- 539 Branstetter Ln
- 742 Branstetter Ln
- 438 Branstetter Ln
- 391 Branstetter Ln
- 4855 Peaceful Ridge Rd
- 4855 Peaceful Ridge Rd
- 375 Branstetter Ln
- 365 Branstetter Ln
- 4741 Peaceful Ridge Rd
- 4587 Peaceful Ridge Rd
- 345 Branstetter Ln
- 4781 Peaceful Ridge Rd
- 272 Branstetter Ln
- 329 Branstetter Ln