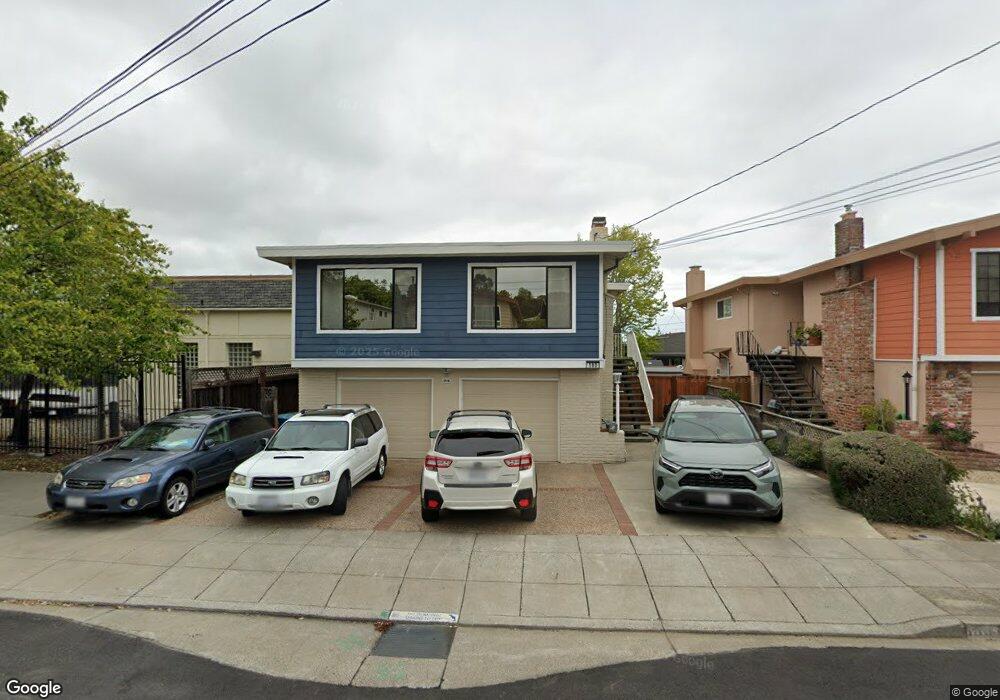
580 Maple Ave San Bruno, CA 94066
Mills Park NeighborhoodEstimated Value: $1,361,000 - $1,466,071
3
Beds
2
Baths
1,380
Sq Ft
$1,033/Sq Ft
Est. Value
About This Home
This home is located at 580 Maple Ave, San Bruno, CA 94066 and is currently estimated at $1,425,268, approximately $1,032 per square foot. 580 Maple Ave is a home located in San Mateo County with nearby schools including John Muir Elementary School, Parkside Intermediate School, and Capuchino High School.
Ownership History
Date
Name
Owned For
Owner Type
Purchase Details
Closed on
Oct 7, 2010
Sold by
Christopherson Juanita
Bought by
Christopherson Juanita
Current Estimated Value
Home Financials for this Owner
Home Financials are based on the most recent Mortgage that was taken out on this home.
Original Mortgage
$267,500
Outstanding Balance
$175,711
Interest Rate
4.26%
Mortgage Type
New Conventional
Estimated Equity
$1,249,557
Purchase Details
Closed on
Jun 4, 2010
Sold by
Christopherson Juanita
Bought by
Christopherson Juanita
Purchase Details
Closed on
Mar 13, 1998
Sold by
Remedios Elfrida I
Bought by
Christopherson Ronald T and Christopherson Juanita
Home Financials for this Owner
Home Financials are based on the most recent Mortgage that was taken out on this home.
Original Mortgage
$194,500
Interest Rate
7.02%
Create a Home Valuation Report for This Property
The Home Valuation Report is an in-depth analysis detailing your home's value as well as a comparison with similar homes in the area
Home Values in the Area
Average Home Value in this Area
Purchase History
We collect this data history from publicly available records. To have your information removed, we recommend requesting removal directly through your county’s website.
| Date | Buyer | Sale Price | Title Company |
|---|---|---|---|
| Christopherson Juanita | -- | Accommodation | |
| Christopherson Juanita | -- | Fidelity National Title Co | |
| Christopherson Juanita | -- | None Available | |
| Christopherson Ronald T | -- | Fidelity National Title Co |
Source: Public Records
Mortgage History
We collect this data history from publicly available records. To have your information removed, we recommend requesting removal directly through your county’s website.
| Date | Status | Borrower | Loan Amount |
|---|---|---|---|
| Open | Christopherson Juanita | $267,500 | |
| Closed | Christopherson Ronald T | $194,500 |
Source: Public Records
Tax History
| Year | Tax Paid | Tax Assessment Tax Assessment Total Assessment is a certain percentage of the fair market value that is determined by local assessors to be the total taxable value of land and additions on the property. | Land | Improvement |
|---|---|---|---|---|
| 2025 | $7,297 | $511,145 | $153,107 | $358,038 |
| 2023 | $7,297 | $491,298 | $147,162 | $344,136 |
| 2022 | $5,319 | $481,666 | $144,277 | $337,389 |
| 2021 | $5,250 | $472,223 | $141,449 | $330,774 |
| 2020 | $5,200 | $467,382 | $139,999 | $327,383 |
| 2019 | $5,114 | $458,218 | $137,254 | $320,964 |
| 2018 | $4,861 | $449,234 | $134,563 | $314,671 |
| 2017 | $4,808 | $440,426 | $131,925 | $308,501 |
| 2016 | $4,705 | $431,791 | $129,339 | $302,452 |
| 2015 | $4,642 | $425,306 | $127,397 | $297,909 |
| 2014 | $4,573 | $416,976 | $124,902 | $292,074 |
Source: Public Records
Map
Nearby Homes
- 519 Beech Ave
- 1225 Park Ave
- 474 Beech Ave
- 744 Pepper Dr
- 4222 Shelter Creek Ln Unit 4222
- 2101 Shelter Creek Ln Unit 2101
- 2316 Shelter Creek Ln Unit 2316
- 7101 Shelter Creek Ln
- 2149 Shelter Creek Ln
- 5146 Shelter Creek Ln Unit 5146
- 8109 Shelter Creek Ln Unit 8109
- 8307 Shelter Creek Ln Unit 8307
- 8310 Shelter Creek Ln Unit 8310
- 6143 Shelter Creek Ln
- 7246 Shelter Creek Ln
- 7221 Shelter Creek Ln
- 3135 Shelter Creek Ln
- 8150 Shelter Creek Ln
- 440 Madison Ave
- 271 El Camino Real
Your Personal Tour Guide
Ask me questions while you tour the home.