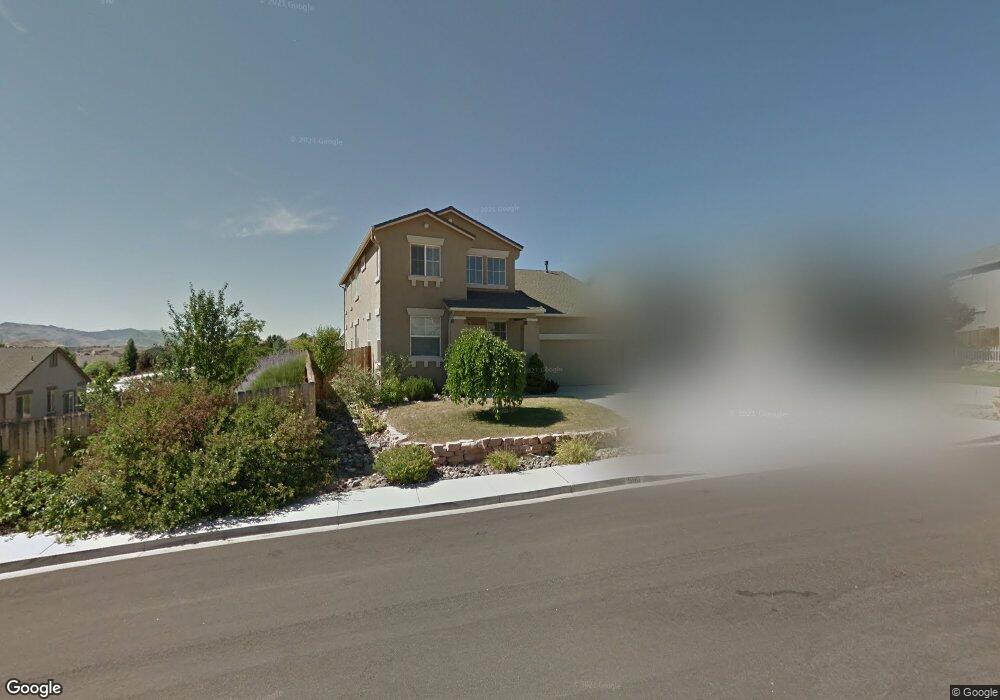
580 Muir Pass Ct Sparks, NV 89436
Sparks Galleria NeighborhoodEstimated Value: $550,000 - $583,000
3
Beds
3
Baths
2,058
Sq Ft
$275/Sq Ft
Est. Value
About This Home
This home is located at 580 Muir Pass Ct, Sparks, NV 89436 and is currently estimated at $566,536, approximately $275 per square foot. 580 Muir Pass Ct is a home located in Washoe County with nearby schools including Miguel Sepulveda Elementary School, Sky Ranch Middle School, and Edward C Reed High School.
Ownership History
Date
Name
Owned For
Owner Type
Purchase Details
Closed on
Nov 10, 2011
Sold by
Federal Home Loan Mortgage Corporation
Bought by
Padilla Figueroa Moises
Current Estimated Value
Home Financials for this Owner
Home Financials are based on the most recent Mortgage that was taken out on this home.
Original Mortgage
$169,589
Outstanding Balance
$118,289
Interest Rate
4.5%
Mortgage Type
FHA
Estimated Equity
$448,247
Purchase Details
Closed on
Jul 25, 2011
Sold by
Elliott Charles W and Elliott Margaret H
Bought by
Federal Home Loan Mortgage Corporation
Purchase Details
Closed on
Aug 12, 2003
Sold by
Barker Coleman Construction Llc
Bought by
Elliott Charles W and Elliott Margaret H
Home Financials for this Owner
Home Financials are based on the most recent Mortgage that was taken out on this home.
Original Mortgage
$216,720
Interest Rate
5.29%
Mortgage Type
Balloon
Create a Home Valuation Report for This Property
The Home Valuation Report is an in-depth analysis detailing your home's value as well as a comparison with similar homes in the area
Home Values in the Area
Average Home Value in this Area
Purchase History
| Date | Buyer | Sale Price | Title Company |
|---|---|---|---|
| Padilla Figueroa Moises | $174,000 | Servicelink Irvine | |
| Federal Home Loan Mortgage Corporation | $177,500 | Lsi Title Agency Inc | |
| Elliott Charles W | $240,805 | Stewart Title Of Northern Nv |
Source: Public Records
Mortgage History
| Date | Status | Borrower | Loan Amount |
|---|---|---|---|
| Open | Padilla Figueroa Moises | $169,589 | |
| Previous Owner | Elliott Charles W | $216,720 |
Source: Public Records
Tax History Compared to Growth
Tax History
| Year | Tax Paid | Tax Assessment Tax Assessment Total Assessment is a certain percentage of the fair market value that is determined by local assessors to be the total taxable value of land and additions on the property. | Land | Improvement |
|---|---|---|---|---|
| 2025 | $3,499 | $121,977 | $36,855 | $85,122 |
| 2024 | $3,499 | $116,402 | $30,450 | $85,952 |
| 2023 | $3,247 | $116,585 | $35,210 | $81,375 |
| 2022 | $3,006 | $94,390 | $26,985 | $67,405 |
| 2021 | $2,781 | $90,392 | $23,310 | $67,082 |
| 2020 | $2,613 | $89,948 | $22,750 | $67,198 |
| 2019 | $2,489 | $87,519 | $22,470 | $65,049 |
| 2018 | $2,375 | $79,988 | $16,275 | $63,713 |
| 2017 | $2,281 | $79,451 | $15,680 | $63,771 |
| 2016 | $2,224 | $79,308 | $14,490 | $64,818 |
| 2015 | $2,218 | $78,730 | $14,035 | $64,695 |
| 2014 | $2,150 | $72,706 | $10,640 | $62,066 |
| 2013 | -- | $57,533 | $8,855 | $48,678 |
Source: Public Records
Map
Nearby Homes
- 585 Sonora Pass Ct
- 7290 Pah Rah Dr
- 551 E Equinox Peak Ct
- 551 E Equinox Peak Ct Unit Homesite 2035
- 532 E Equinox Peak Ct Unit Homesite 2045
- 521 E Equinox Peak Ct
- 521 E Equinox Peak Ct Unit Homesite 2038
- 5651 Hunting Creek Way
- 601 W Equinox Peak Ct
- 601 W Equinox Peak Ct Unit Homesite 2030
- 6920 Pah Rah Dr
- 7395 Pah Rah Dr Unit 3B
- 6835 Pah Rah Dr
- 2084 Great Bluffs Ln Unit Homesite 5132
- 2094 Great Bluffs Ln Unit Homesite 5133
- 7129 Singing Tree Rd Unit Homesite 5121
- 650 Panama Dr
- 6835 Summit View Dr
- 6560 Pyramid Way Unit 52
- 5365 Ebbetts Pass Dr
- 570 Muir Pass Ct
- 5641 Cathedral Peak Dr
- 5631 Cathedral Peak Dr
- 560 Muir Pass Ct
- 585 Muir Pass Ct
- 575 Muir Pass Ct
- 5661 Cathedral Peak Dr
- 5611 Cathedral Peak Dr
- 565 Muir Pass Ct
- 5636 Cathedral Peak Dr
- 5671 Cathedral Peak Dr
- 5656 Cathedral Peak Dr
- 5626 Cathedral Peak Dr
- 544 Sonora Pass Ct
- 564 Sonora Pass Ct
- 574 Sonora Pass Ct
- 554 Sonora Pass Ct
- 7160 Pah Rah Dr
- 5616 Cathedral Peak Dr
- 7150 Pah Rah Dr