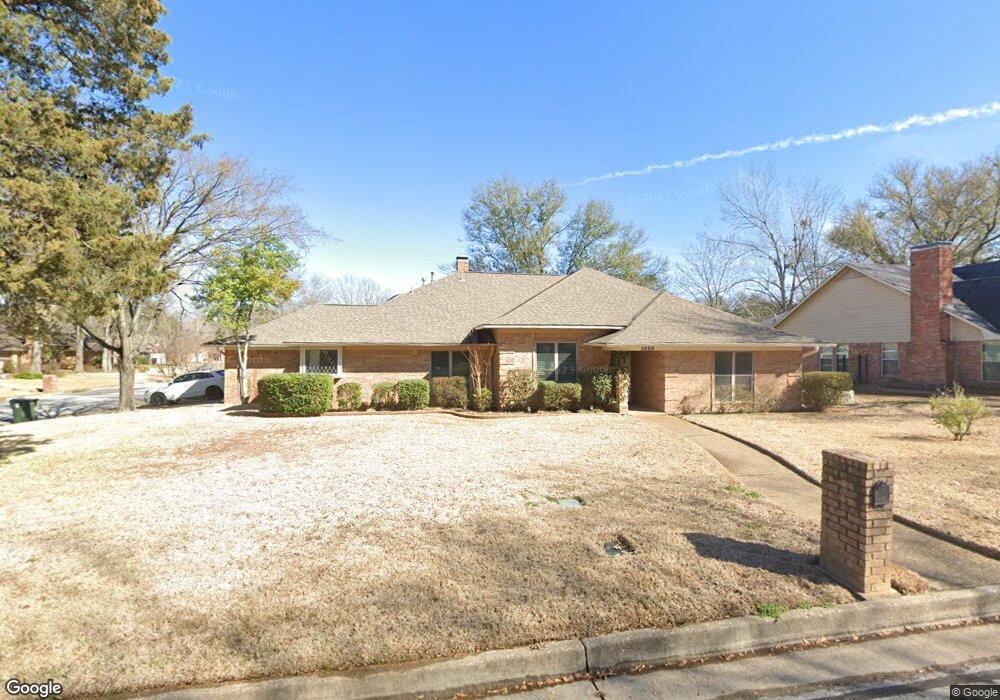
5800 5800 Sheffield Dr Tyler, TX 75703
Stoneleigh NeighborhoodEstimated Value: $399,000 - $489,000
--
Bed
3
Baths
2,352
Sq Ft
$185/Sq Ft
Est. Value
About This Home
This home is located at 5800 5800 Sheffield Dr, Tyler, TX 75703 and is currently estimated at $435,645, approximately $185 per square foot. 5800 5800 Sheffield Dr is a home located in Smith County with nearby schools including Rice Elementary School, Hubbard Middle School, and Tyler Legacy High School.
Ownership History
Date
Name
Owned For
Owner Type
Purchase Details
Closed on
Oct 26, 2021
Sold by
Dorr Philip D and Dorr Erin
Bought by
Kane Alexandra M
Current Estimated Value
Home Financials for this Owner
Home Financials are based on the most recent Mortgage that was taken out on this home.
Original Mortgage
$344,250
Outstanding Balance
$303,803
Interest Rate
2.8%
Mortgage Type
Stand Alone Second
Estimated Equity
$131,842
Purchase Details
Closed on
Aug 12, 2015
Sold by
Martell Ronald A and Martell Karen I
Bought by
Dorr Philip D and Dorr Erin
Home Financials for this Owner
Home Financials are based on the most recent Mortgage that was taken out on this home.
Original Mortgage
$102,500
Interest Rate
4.12%
Mortgage Type
New Conventional
Purchase Details
Closed on
Jul 1, 2005
Sold by
Watanabe Katsuhiko and Han Ji Hee
Bought by
Martell Ronald A and Martell Karen I
Home Financials for this Owner
Home Financials are based on the most recent Mortgage that was taken out on this home.
Original Mortgage
$138,000
Interest Rate
5.64%
Mortgage Type
New Conventional
Create a Home Valuation Report for This Property
The Home Valuation Report is an in-depth analysis detailing your home's value as well as a comparison with similar homes in the area
Home Values in the Area
Average Home Value in this Area
Purchase History
| Date | Buyer | Sale Price | Title Company |
|---|---|---|---|
| Kane Alexandra M | -- | None Available | |
| Dorr Philip D | -- | Texas Pioneer Title Agency | |
| Dorr Philip D | -- | None Available | |
| Martell Ronald A | -- | None Available |
Source: Public Records
Mortgage History
| Date | Status | Borrower | Loan Amount |
|---|---|---|---|
| Open | Kane Alexandra M | $344,250 | |
| Previous Owner | Dorr Philip D | $102,500 | |
| Previous Owner | Martell Ronald A | $138,000 |
Source: Public Records
Tax History Compared to Growth
Tax History
| Year | Tax Paid | Tax Assessment Tax Assessment Total Assessment is a certain percentage of the fair market value that is determined by local assessors to be the total taxable value of land and additions on the property. | Land | Improvement |
|---|---|---|---|---|
| 2025 | $5,451 | $353,660 | $53,706 | $299,954 |
| 2024 | $5,451 | $379,240 | $58,030 | $321,210 |
| 2023 | $6,341 | $406,218 | $58,030 | $348,188 |
| 2022 | $6,479 | $330,714 | $41,450 | $289,264 |
| 2021 | $5,270 | $251,184 | $41,450 | $209,734 |
| 2020 | $5,231 | $244,473 | $41,450 | $203,023 |
| 2019 | $4,896 | $223,898 | $33,160 | $190,738 |
| 2018 | $4,627 | $212,737 | $33,160 | $179,577 |
| 2017 | $4,542 | $212,737 | $33,160 | $179,577 |
| 2016 | $4,465 | $209,160 | $33,160 | $176,000 |
| 2015 | $3,828 | $201,758 | $33,160 | $168,598 |
| 2014 | $3,828 | $191,843 | $33,160 | $158,683 |
Source: Public Records
Map
Nearby Homes
- 1212 Parkview Dr
- 5803 Stoneleigh Dr
- 973 Creekside Dr
- 5900 Stoneleigh Dr
- 5701 Plantation Dr
- 5829 Brynmar Ct
- 716 Chimney Rock Dr
- 5401 Hollytree Dr
- 5401 Hollytree Dr Unit 1002
- 6001 Huntington Dr
- 709 W Rieck Rd
- 5802 Briar Creek Dr
- 1869 Hollylake Cir
- 717 Meadow Creek Dr
- 1915 Hollyglen Dr
- 5290 Tyler Park Dr
- 1202 Rice Rd
- 709 Top Hill Dr
- 802 Carriage Dr
- 608 Top Hill Dr
- 5800 Sheffield Dr
- 5802 5802 Sheffield
- 5802 Sheffield Dr
- 5805 5805 Hollytree
- 5804 Sheffield Dr
- 5801 Hollytree Dr
- 5803 5803 Hollytree
- 5804 5804 Sheffield Dr
- 5803 Hollytree Dr
- 5805 Hollytree Dr
- 5801 Sheffield Dr
- 5807 Hollytree Dr
- 5807 5807 Hollytree
- 5803 Sheffield Dr
- 5809 Hollytree Dr
- 5803 5803 Sheffield Dr
- 5809 5809 Hollytree
- 1105 Wimbledon Dr
- 1103 Wimbledon Dr
- 5811 5811 Hollytree