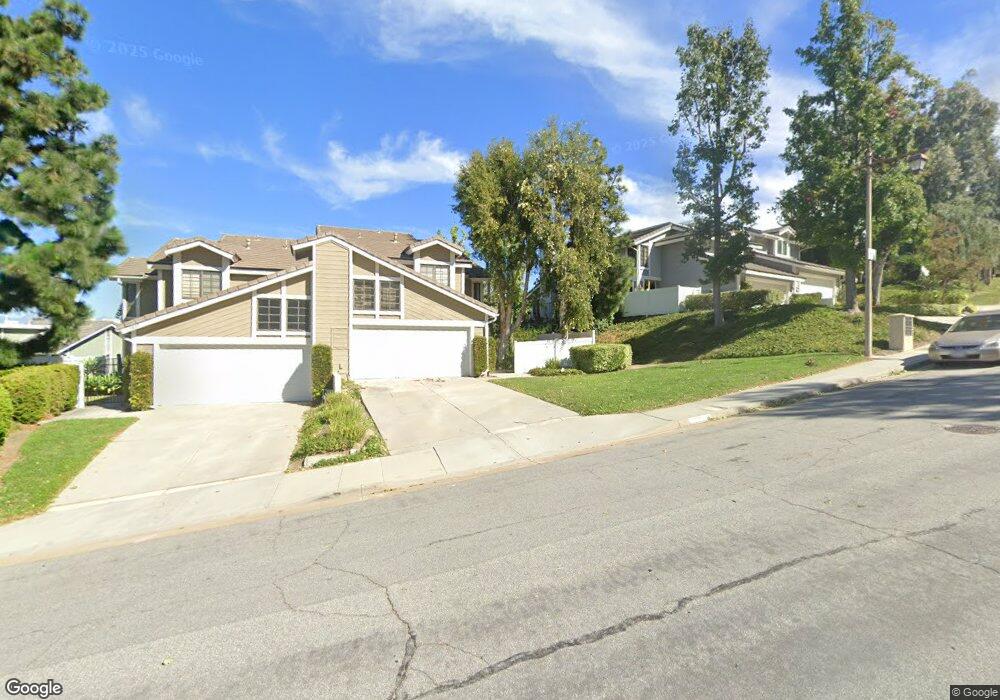
5800 E Mountain Loop Trail Unit 33 Anaheim, CA 92807
Anaheim Hills NeighborhoodEstimated Value: $954,000 - $1,274,000
3
Beds
3
Baths
1,756
Sq Ft
$602/Sq Ft
Est. Value
About This Home
This home is located at 5800 E Mountain Loop Trail Unit 33, Anaheim, CA 92807 and is currently estimated at $1,056,577, approximately $601 per square foot. 5800 E Mountain Loop Trail Unit 33 is a home located in Orange County with nearby schools including Imperial Elementary School, Canyon High School, and El Rancho Charter.
Ownership History
Date
Name
Owned For
Owner Type
Purchase Details
Closed on
May 27, 1994
Sold by
Federal National Mortgage Association
Bought by
King William E and King Angela G
Current Estimated Value
Home Financials for this Owner
Home Financials are based on the most recent Mortgage that was taken out on this home.
Original Mortgage
$168,150
Interest Rate
8.6%
Purchase Details
Closed on
Feb 23, 1994
Sold by
Cal Western Reconveyance Corp
Bought by
Federal National Mortgage Association
Purchase Details
Closed on
Oct 5, 1993
Sold by
Great Pacific Industries Inc
Bought by
Quality Performance and Development L T D
Purchase Details
Closed on
Oct 1, 1993
Sold by
Ravitch Adella L
Bought by
Great Pacific Industries Inc and Radical Apparel Design
Create a Home Valuation Report for This Property
The Home Valuation Report is an in-depth analysis detailing your home's value as well as a comparison with similar homes in the area
Home Values in the Area
Average Home Value in this Area
Purchase History
| Date | Buyer | Sale Price | Title Company |
|---|---|---|---|
| King William E | $177,000 | -- | |
| Federal National Mortgage Association | $193,653 | North American Title Co | |
| Quality Performance | -- | -- | |
| Great Pacific Industries Inc | -- | -- |
Source: Public Records
Mortgage History
| Date | Status | Borrower | Loan Amount |
|---|---|---|---|
| Closed | King William E | $168,150 |
Source: Public Records
Tax History
| Year | Tax Paid | Tax Assessment Tax Assessment Total Assessment is a certain percentage of the fair market value that is determined by local assessors to be the total taxable value of land and additions on the property. | Land | Improvement |
|---|---|---|---|---|
| 2025 | $3,430 | $300,832 | $81,359 | $219,473 |
| 2024 | $3,430 | $294,934 | $79,764 | $215,170 |
| 2023 | $3,350 | $289,151 | $78,200 | $210,951 |
| 2022 | $3,282 | $283,482 | $76,667 | $206,815 |
| 2021 | $3,192 | $277,924 | $75,164 | $202,760 |
| 2020 | $3,162 | $275,075 | $74,394 | $200,681 |
| 2019 | $3,123 | $269,682 | $72,935 | $196,747 |
| 2018 | $3,075 | $264,395 | $71,505 | $192,890 |
| 2017 | $2,951 | $259,211 | $70,103 | $189,108 |
| 2016 | $2,894 | $254,129 | $68,729 | $185,400 |
| 2015 | $2,855 | $250,312 | $67,696 | $182,616 |
| 2014 | $2,794 | $245,409 | $66,370 | $179,039 |
Source: Public Records
Map
Nearby Homes
- 5810 E Mountain Loop Trail Unit 35
- 5889 E Mountain Loop Trail
- 5624 E Vista Del Valle
- 5598 E Stetson Ct Unit 22
- 5447 E Willowick Cir
- 500 S Calle de Casas
- 317 S Vista Del Canon
- 230 S Plaza de Domingos
- 5516 E Vista Del Dia
- 5548 E Vista Del Este
- 5559 E Vista Del Dia
- 5532 E Vista Del Este
- 5573 E Vista Del Rio
- 5901 E Firenze Crescent
- 6093 E Brighton Ln
- 6009 E Summit Ct Unit 38
- 5489 E Suncrest Rd
- 397 S San Vicente Ln Unit 31
- 5146 E Hunsford Dr Unit E
- 131 S Francisco St
- 5802 E Mountain Loop Trail
- 5801 E Trapper Trail
- 5807 E Trapper Trail Unit 31
- 5807 E Trapper Trail
- 5812 E Mountain Loop Trail
- 5813 E Trapper Trail
- 5803 E Mountain Loop Trail Unit 26
- 5803 E Mountain Loop Trail
- 541 S Indian Trail Unit 43
- 541 S Indian Trail
- 545 S Indian Trail Unit 44
- 535 S Indian Trail Unit 42
- 535 S Indian Trail
- 5805 E Mountain Loop Trail
- 5818 E Mountain Loop Trail
- 531 S Indian Trail Unit 41
- 5819 E Trapper Trail Unit 29
- 5819 E Trapper Trail
- 5809 E Mountain Loop Trail Unit 24
- 5811 E Mountain Loop Trail