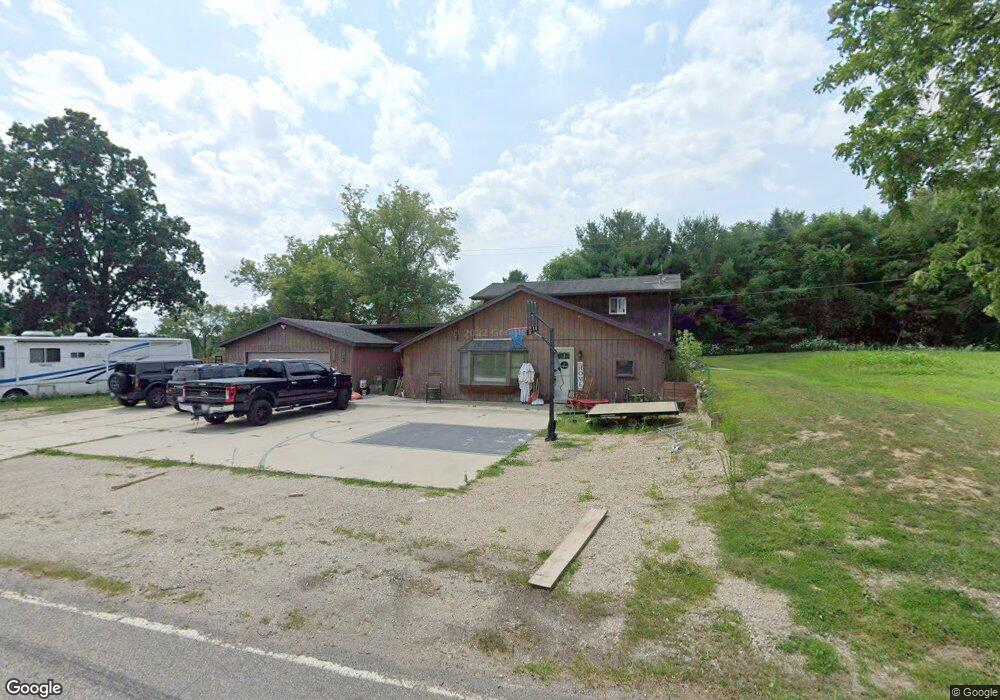
5800 Hinkley Rd Unit HINKLEY Stockbridge, MI 49285
Estimated Value: $255,000 - $294,000
3
Beds
2
Baths
1,300
Sq Ft
$215/Sq Ft
Est. Value
About This Home
This home is located at 5800 Hinkley Rd Unit HINKLEY, Stockbridge, MI 49285 and is currently estimated at $279,444, approximately $214 per square foot. 5800 Hinkley Rd Unit HINKLEY is a home located in Jackson County with nearby schools including Emma Smith Elementary School, Heritage School, and Stockbridge High School.
Ownership History
Date
Name
Owned For
Owner Type
Purchase Details
Closed on
Jul 21, 2014
Sold by
Chmielewski Michale J and Chmilewski Nathas S
Bought by
Chmielewski Michale J and Chmielewski Nathas S
Current Estimated Value
Purchase Details
Closed on
Oct 2, 2008
Sold by
Everhome Mortgage Company
Bought by
Federal National Mortgage Association
Create a Home Valuation Report for This Property
The Home Valuation Report is an in-depth analysis detailing your home's value as well as a comparison with similar homes in the area
Home Values in the Area
Average Home Value in this Area
Purchase History
| Date | Buyer | Sale Price | Title Company |
|---|---|---|---|
| Chmielewski Michale J | -- | At | |
| Federal National Mortgage Association | -- | None Available |
Source: Public Records
Tax History Compared to Growth
Tax History
| Year | Tax Paid | Tax Assessment Tax Assessment Total Assessment is a certain percentage of the fair market value that is determined by local assessors to be the total taxable value of land and additions on the property. | Land | Improvement |
|---|---|---|---|---|
| 2025 | $1,465 | $133,950 | $0 | $0 |
| 2024 | $562 | $125,850 | $0 | $0 |
| 2023 | $520 | $111,800 | $0 | $0 |
| 2022 | $1,240 | $84,050 | $0 | $0 |
| 2021 | $1,180 | $76,200 | $0 | $0 |
| 2020 | $1,165 | $67,700 | $0 | $0 |
| 2019 | $1,122 | $59,700 | $0 | $0 |
| 2018 | $1,096 | $56,250 | $0 | $0 |
| 2017 | $1,028 | $47,450 | $0 | $0 |
| 2016 | $416 | $45,200 | $45,200 | $0 |
| 2015 | $972 | $46,350 | $46,350 | $0 |
| 2014 | $972 | $43,900 | $0 | $0 |
| 2013 | -- | $43,900 | $43,900 | $0 |
Source: Public Records
Map
Nearby Homes
- 5695 Hinkley Rd
- 5599 S M 52
- Lot 7 Lucas Ln
- 0 Green Rd Unit 25034208
- 13201 Rockwell Rd
- 303 Mechanic St
- 0 M-52 Unit 291080
- 630 W Main St W
- 4053 Eastbridge Rd
- 4057 Eastbridge Rd
- 4012 Eastbridge Rd
- 4059 Eastbridge Rd
- 4005 Eastbridge Rd
- 4845 Moechel Rd
- 9963 Harr Rd
- 4100 N Main St
- 0 Harr Rd Unit 25026824
- 10520 Leeke Rd
- 3405 Heeney Rd
- 17535 Bowdish Rd
- 12950 Territorial Rd
- 5802 Hinkley Rd
- 12971 Territorial Rd
- 12940 Territorial Rd
- 13001 Territorial Rd
- 12930 Territorial Rd
- 12900 Territorial Rd
- 6 acres Grosshans Rd
- 5792 Hinkley Rd
- 13090 Grosshans Rd
- 13090 Grosshans Rd
- 12997 Territorial Rd
- 12894 Territorial Rd
- 5790 Hinkley Rd
- 5723 S M 52
- 13075 Territorial Rd
- 5713 S M-52
- 5713 Michigan 52
- 5713 S M 52
- 5713 S M 52 Unit M-52