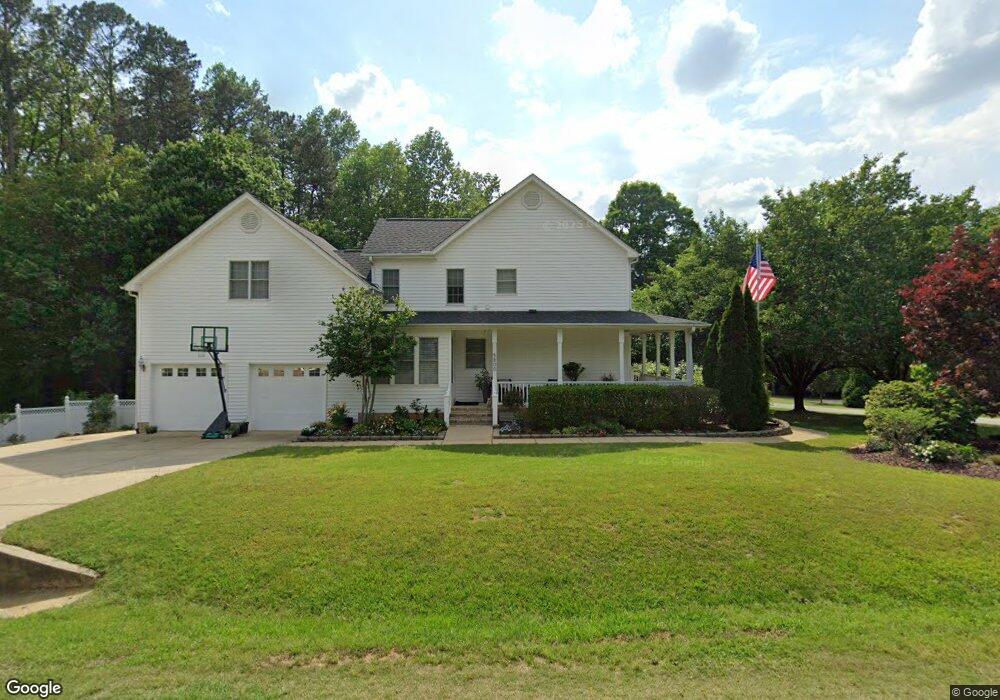
5800 Ranwick Ln Raleigh, NC 27603
Estimated Value: $528,000 - $604,000
3
Beds
4
Baths
2,718
Sq Ft
$211/Sq Ft
Est. Value
About This Home
This home is located at 5800 Ranwick Ln, Raleigh, NC 27603 and is currently estimated at $573,326, approximately $210 per square foot. 5800 Ranwick Ln is a home located in Wake County with nearby schools including Vance Elementary School, North Garner Middle, and Garner High.
Ownership History
Date
Name
Owned For
Owner Type
Purchase Details
Closed on
May 14, 2018
Sold by
Jernigan Phillip and Jernigan Rhonda
Bought by
Price Heather Wilkerson
Current Estimated Value
Home Financials for this Owner
Home Financials are based on the most recent Mortgage that was taken out on this home.
Original Mortgage
$239,925
Outstanding Balance
$206,774
Interest Rate
4.44%
Mortgage Type
New Conventional
Estimated Equity
$366,552
Purchase Details
Closed on
Aug 19, 2005
Sold by
Hammett Rodney W and Hammett Mai T
Bought by
Jernigan Phillip and Jernigan Rhonda
Home Financials for this Owner
Home Financials are based on the most recent Mortgage that was taken out on this home.
Original Mortgage
$259,200
Interest Rate
4.75%
Mortgage Type
Fannie Mae Freddie Mac
Purchase Details
Closed on
Oct 30, 1998
Sold by
Coats Glenn Robert and Coats Merle
Bought by
Hammett Rodney W and Hammett Mai T
Home Financials for this Owner
Home Financials are based on the most recent Mortgage that was taken out on this home.
Original Mortgage
$194,000
Interest Rate
6.61%
Create a Home Valuation Report for This Property
The Home Valuation Report is an in-depth analysis detailing your home's value as well as a comparison with similar homes in the area
Home Values in the Area
Average Home Value in this Area
Purchase History
| Date | Buyer | Sale Price | Title Company |
|---|---|---|---|
| Price Heather Wilkerson | $320,000 | None Available | |
| Jernigan Phillip | $288,000 | None Available | |
| Hammett Rodney W | $230,000 | Fidelity National Title Ins |
Source: Public Records
Mortgage History
| Date | Status | Borrower | Loan Amount |
|---|---|---|---|
| Open | Price Heather Wilkerson | $239,925 | |
| Previous Owner | Jernigan Phillip | $259,200 | |
| Previous Owner | Hammett Rodney W | $194,000 |
Source: Public Records
Tax History Compared to Growth
Tax History
| Year | Tax Paid | Tax Assessment Tax Assessment Total Assessment is a certain percentage of the fair market value that is determined by local assessors to be the total taxable value of land and additions on the property. | Land | Improvement |
|---|---|---|---|---|
| 2025 | $3,338 | $518,800 | $90,000 | $428,800 |
| 2024 | $3,242 | $518,800 | $90,000 | $428,800 |
| 2023 | $2,645 | $336,609 | $48,000 | $288,609 |
| 2022 | $2,451 | $336,609 | $48,000 | $288,609 |
| 2021 | $2,385 | $336,609 | $48,000 | $288,609 |
| 2020 | $2,346 | $336,609 | $48,000 | $288,609 |
| 2019 | $2,256 | $273,805 | $44,000 | $229,805 |
| 2018 | $2,075 | $273,805 | $44,000 | $229,805 |
| 2017 | $1,967 | $273,805 | $44,000 | $229,805 |
| 2016 | $1,927 | $273,805 | $44,000 | $229,805 |
| 2015 | $2,274 | $324,534 | $46,000 | $278,534 |
| 2014 | $2,155 | $324,534 | $46,000 | $278,534 |
Source: Public Records
Map
Nearby Homes
- 936 Elbridge Dr
- 1017 Widgeon Way
- 1200 Misty Morning Way
- 6521 Camellia Creek Dr
- 1220 Turner Woods Dr
- 1025 Azalea Garden Cir
- 1017 Azalea Garden Cir
- 1033 Azalea Garden Cir
- 1037 Azalea Garden Cir
- 10917 Stage Dr
- 1041 Azalea Garden Cir
- 1045 Azalea Garden Cir
- 1053 Azalea Garden Cir
- 1057 Azalea Garden Cir
- 1061 Azalea Garden Cir
- 1005 Turner Meadow Dr
- 1069 Azalea Garden Cir
- 5512 Glenhurst Dr N
- 1065 Azalea Garden Cir
- 2400 Trueway Ln
- 928 Elbridge Dr
- 5805 Ranwick Ln
- 921 Elbridge Dr
- 937 Elbridge Dr
- 5809 Ranwick Ln
- 5813 Ranwick Ln
- 940 Elbridge Dr
- 920 Elbridge Dr
- 5904 Dahlberg Dr
- 5820 Ranwick Ln
- 5908 Dahlberg Dr
- 5817 Ranwick Ln
- 917 Elbridge Dr
- 5912 Dahlberg Dr
- 909 Lendermans Cir
- 916 Elbridge Dr
- 5936 Dahlberg Dr
- 5821 Ranwick Ln
- 908 Lendermans Cir
- 5916 Dahlberg Dr