Estimated Value: $218,000 - $286,000
3
Beds
2
Baths
1,696
Sq Ft
$142/Sq Ft
Est. Value
About This Home
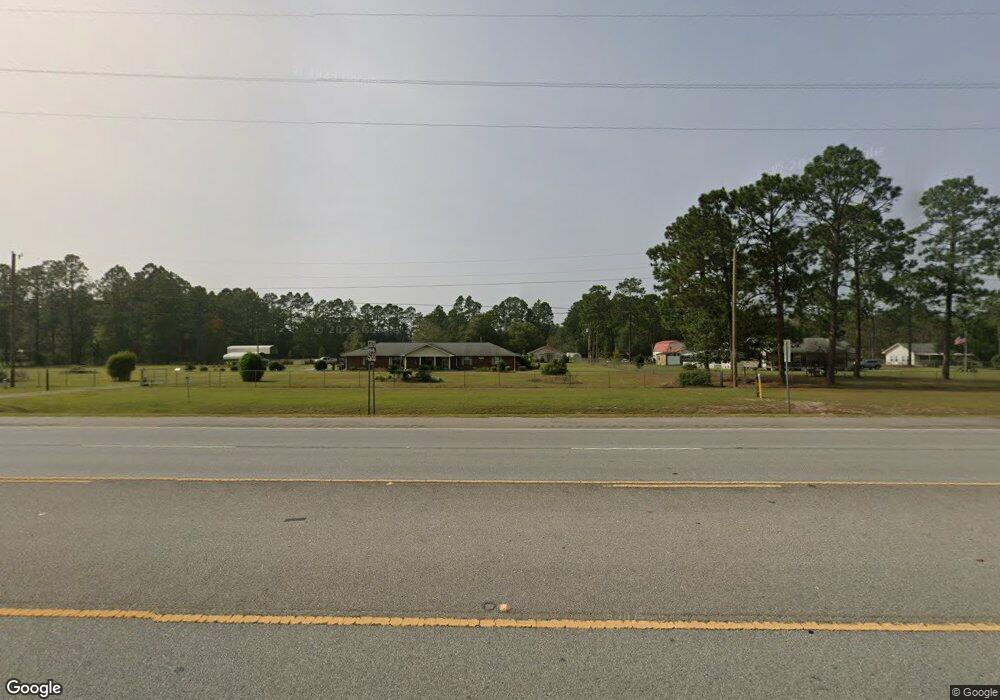
This home is located at 5800 Waycross Hwy, Jesup, GA 31545 and is currently estimated at $241,333, approximately $142 per square foot. 5800 Waycross Hwy is a home located in Wayne County with nearby schools including Bacon Elementary School, Martha Puckett Middle School, and Wayne County High School.
Ownership History
Date
Name
Owned For
Owner Type
Purchase Details
Closed on
Oct 15, 2014
Sold by
Mullis Crystal D
Bought by
Mullis Stacy Bryan and Mullis Crystal D
Current Estimated Value
Home Financials for this Owner
Home Financials are based on the most recent Mortgage that was taken out on this home.
Original Mortgage
$94,000
Outstanding Balance
$72,565
Interest Rate
4.29%
Mortgage Type
New Conventional
Estimated Equity
$168,768
Purchase Details
Closed on
Oct 13, 2014
Sold by
Knighten Carey E
Bought by
Mullis Crystal D
Home Financials for this Owner
Home Financials are based on the most recent Mortgage that was taken out on this home.
Original Mortgage
$94,000
Outstanding Balance
$72,565
Interest Rate
4.29%
Mortgage Type
New Conventional
Estimated Equity
$168,768
Purchase Details
Closed on
Feb 1, 2003
Sold by
Manning Ernest Stephen and Gloria Diane
Bought by
Knighten Crystal D and Knighten Carey E
Purchase Details
Closed on
Feb 1, 1988
Bought by
Stephen Manning Ernest and Diane Gloria
Purchase Details
Closed on
Apr 1, 1981
Create a Home Valuation Report for This Property
The Home Valuation Report is an in-depth analysis detailing your home's value as well as a comparison with similar homes in the area
Home Values in the Area
Average Home Value in this Area
Purchase History
| Date | Buyer | Sale Price | Title Company |
|---|---|---|---|
| Mullis Stacy Bryan | -- | -- | |
| Mullis Crystal D | -- | -- | |
| Knighten Crystal D | $78,700 | -- | |
| Stephen Manning Ernest | $56,000 | -- | |
| -- | -- | -- |
Source: Public Records
Mortgage History
| Date | Status | Borrower | Loan Amount |
|---|---|---|---|
| Open | Mullis Stacy Bryan | $94,000 | |
| Closed | Mullis Crystal D | $94,000 |
Source: Public Records
Tax History Compared to Growth
Tax History
| Year | Tax Paid | Tax Assessment Tax Assessment Total Assessment is a certain percentage of the fair market value that is determined by local assessors to be the total taxable value of land and additions on the property. | Land | Improvement |
|---|---|---|---|---|
| 2024 | $1,346 | $55,796 | $3,048 | $52,748 |
| 2023 | $770 | $49,208 | $3,048 | $46,160 |
| 2022 | $1,101 | $39,984 | $3,048 | $36,936 |
| 2021 | $1,004 | $34,769 | $3,048 | $31,721 |
| 2020 | $1,040 | $34,801 | $3,080 | $31,721 |
| 2019 | $1,071 | $34,801 | $3,080 | $31,721 |
| 2018 | $1,071 | $34,801 | $3,080 | $31,721 |
| 2017 | $922 | $34,801 | $3,080 | $31,721 |
| 2016 | $892 | $34,801 | $3,080 | $31,721 |
| 2014 | $894 | $34,801 | $3,080 | $31,721 |
| 2013 | -- | $34,800 | $3,080 | $31,720 |
Source: Public Records
Map
Nearby Homes
- 675 Foxwood Cir
- 1351 Old Screven Rd
- 7014 Waycross Hwy
- 7114 Waycross Hwy
- 7132 Waycross Hwy
- 188 Bennetts Cir
- 129 Norris Dr
- 3808 Waycross Hwy
- 168 Nature Cir
- 9009 Waycross Hwy
- 00 Photonia Ave
- 125 Sugar Maple St
- 1435 Bennett Crossing
- 1361 Joey Williamson Rd
- 1361 Joey Williamson Rd Jesup Ga
- 113 Vixenhill Dr
- TRACT 1 Sunset Blvd
- 00 Sunset Blvd
- 0 Sunset Blvd
- TRACT 2 Sunset Blvd
- 5806 Waycross Hwy
- 5768 Waycross Hwy
- 5842 Waycross Hwy
- 5920 Waycross Hwy
- 5815 Waycross Hwy
- 5885 Waycross Hwy
- 5963 Waycross Hwy
- 5730 Waycross Hwy
- 5976 Waycross Hwy
- 108 Mona Ave
- 5670 Waycross Hwy
- 234 Mona Ave
- 280 Mona Ave
- 267 Mona Ave Unit n/a
- 267 Mona Ave
- 215 Mona Ave
- 5665 Waycross Hwy
- 5635 Waycross Hwy
- 5686 Waycross Hwy
- 450 Mona Ave