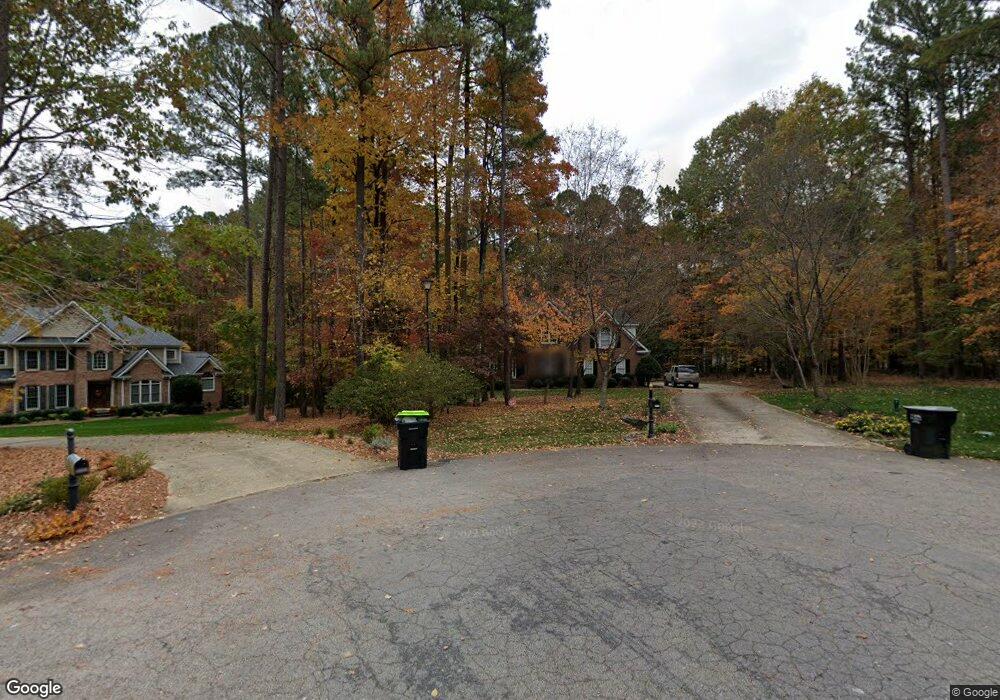
5801 Stone Spring Rd Raleigh, NC 27613
Falls Lake NeighborhoodEstimated Value: $798,786 - $849,000
4
Beds
4
Baths
3,093
Sq Ft
$266/Sq Ft
Est. Value
About This Home
This home is located at 5801 Stone Spring Rd, Raleigh, NC 27613 and is currently estimated at $821,697, approximately $265 per square foot. 5801 Stone Spring Rd is a home located in Wake County with nearby schools including West Millbrook Middle School, Leesville Road High School, and The Franciscan School.
Ownership History
Date
Name
Owned For
Owner Type
Purchase Details
Closed on
Aug 15, 2014
Sold by
Duff Terry O and Duff Shirley
Bought by
Fenton Mark and Fenton Melissa
Current Estimated Value
Home Financials for this Owner
Home Financials are based on the most recent Mortgage that was taken out on this home.
Original Mortgage
$332,000
Outstanding Balance
$244,766
Interest Rate
3.25%
Mortgage Type
Adjustable Rate Mortgage/ARM
Estimated Equity
$576,931
Purchase Details
Closed on
Jul 12, 2002
Sold by
Duff Terry O and Duff Shirley A
Bought by
Duff Terry O and Duff Shirley A
Purchase Details
Closed on
Dec 8, 1997
Sold by
Eddie Wilson Custom Homes Inc
Bought by
Duff Terry O and Hill Shirley A
Home Financials for this Owner
Home Financials are based on the most recent Mortgage that was taken out on this home.
Original Mortgage
$150,000
Interest Rate
7.19%
Create a Home Valuation Report for This Property
The Home Valuation Report is an in-depth analysis detailing your home's value as well as a comparison with similar homes in the area
Home Values in the Area
Average Home Value in this Area
Purchase History
| Date | Buyer | Sale Price | Title Company |
|---|---|---|---|
| Fenton Mark | $415,000 | None Available | |
| Duff Terry O | -- | -- | |
| Duff Terry O | $345,000 | -- |
Source: Public Records
Mortgage History
| Date | Status | Borrower | Loan Amount |
|---|---|---|---|
| Open | Fenton Mark | $332,000 | |
| Previous Owner | Duff Terry O | $150,000 |
Source: Public Records
Tax History
| Year | Tax Paid | Tax Assessment Tax Assessment Total Assessment is a certain percentage of the fair market value that is determined by local assessors to be the total taxable value of land and additions on the property. | Land | Improvement |
|---|---|---|---|---|
| 2025 | $4,848 | $754,898 | $190,000 | $564,898 |
| 2024 | $4,708 | $754,898 | $190,000 | $564,898 |
Source: Public Records
Map
Nearby Homes
- 2617 Scarlet Sage Ct
- 2317 Primrose Valley Ct
- 2509 Barton Ridge Ct
- 5128 Terra Cotta Dr
- 12204 Warwickshire Way
- 2616 Jasper Ln
- 12304 Whartons Way
- 2013 Kinleys Way
- 8717 Little Deer Ln
- 4701 Regalwood Dr
- 4716 Regalwood Dr
- 3412 Horseshoe Bend
- 5222 Swisswood Dr
- 7119 Wexford Woods Trail
- 5016 Elkwood Ct
- 5640 Blackhawk Rd
- 2506 Coley Rd
- 5632 Blackhawk Rd
- 11708 Black Horse Run
- 5201 Golden Moss Trail
- 5800 Stone Spring Rd
- 5805 Stone Spring Rd
- 2320 Sunnystone Way
- 2316 Sunnystone Way
- 5804 Stone Spring Rd
- 5812 Stone Spring Rd
- 2324 Sunnystone Way
- 2312 Sunnystone Way
- 5809 Stone Spring Rd
- 2308 Sunnystone Way
- 2400 Sunnystone Way
- 2309 Sunnystone Way
- 5817 Stone Spring Rd
- 5816 Stone Spring Rd
- 12701 Victory Church Rd
- 5801 Stone Canyon Ct
- 5800 Stone Canyon Ct
- 2325 Sunnystone Way
- 5800 Sand Pebble Place
- 5805 Rocky Point Ct
Your Personal Tour Guide
Ask me questions while you tour the home.