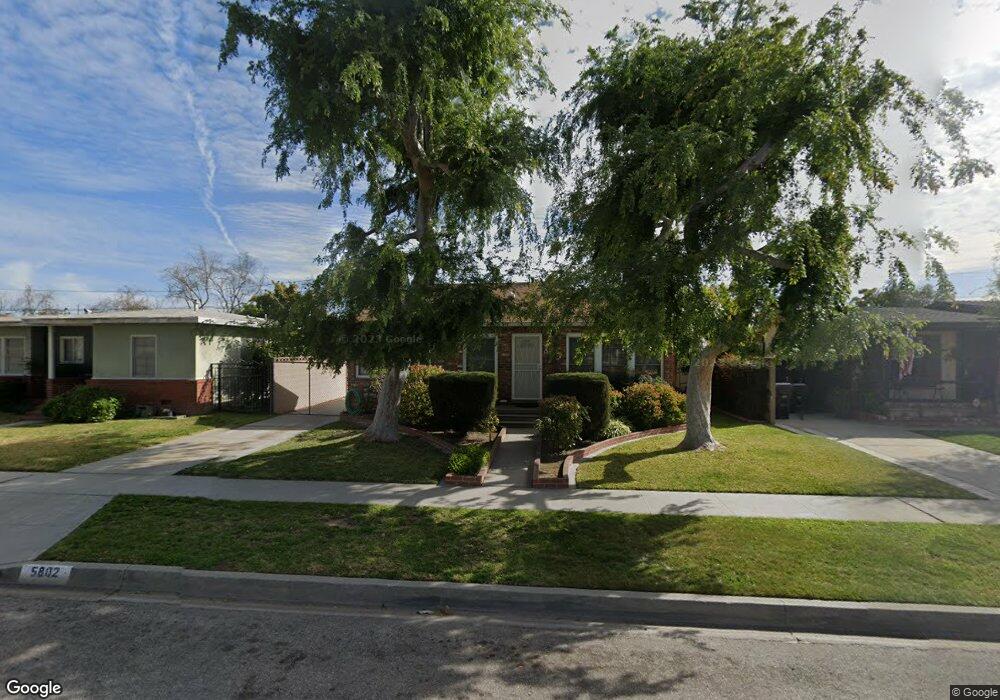
5802 E Lanai St Long Beach, CA 90808
West Plaza NeighborhoodEstimated Value: $977,322 - $1,128,000
2
Beds
2
Baths
1,737
Sq Ft
$588/Sq Ft
Est. Value
About This Home
This home is located at 5802 E Lanai St, Long Beach, CA 90808 and is currently estimated at $1,021,331, approximately $587 per square foot. 5802 E Lanai St is a home located in Los Angeles County with nearby schools including Burcham Elementary School, Marshall Academy of the Arts, and Millikan High School.
Ownership History
Date
Name
Owned For
Owner Type
Purchase Details
Closed on
Jul 22, 2011
Sold by
Basch Christine A
Bought by
Basch Christine A and Basch Trust
Current Estimated Value
Purchase Details
Closed on
Jan 7, 2010
Sold by
Basch Richard R and Basch Christine A
Bought by
Basch Richard E and Basch Christine A
Home Financials for this Owner
Home Financials are based on the most recent Mortgage that was taken out on this home.
Original Mortgage
$284,478
Interest Rate
4.91%
Mortgage Type
New Conventional
Purchase Details
Closed on
Nov 5, 2001
Sold by
Basch Richard E and Basch Christine A
Bought by
Basch Richard E and Basch Christine A
Create a Home Valuation Report for This Property
The Home Valuation Report is an in-depth analysis detailing your home's value as well as a comparison with similar homes in the area
Home Values in the Area
Average Home Value in this Area
Purchase History
| Date | Buyer | Sale Price | Title Company |
|---|---|---|---|
| Basch Christine A | -- | None Available | |
| Basch Richard E | -- | First American Title Company | |
| Basch Richard E | -- | -- |
Source: Public Records
Mortgage History
| Date | Status | Borrower | Loan Amount |
|---|---|---|---|
| Closed | Basch Richard E | $284,478 |
Source: Public Records
Tax History
| Year | Tax Paid | Tax Assessment Tax Assessment Total Assessment is a certain percentage of the fair market value that is determined by local assessors to be the total taxable value of land and additions on the property. | Land | Improvement |
|---|---|---|---|---|
| 2025 | $2,844 | $210,908 | $83,024 | $127,884 |
| 2024 | $2,844 | $206,774 | $81,397 | $125,377 |
| 2023 | $2,796 | $202,720 | $79,801 | $122,919 |
| 2022 | $2,629 | $198,746 | $78,237 | $120,509 |
| 2021 | $2,568 | $194,850 | $76,703 | $118,147 |
| 2020 | $2,558 | $192,853 | $75,917 | $116,936 |
| 2019 | $2,528 | $189,073 | $74,429 | $114,644 |
| 2018 | $2,409 | $185,367 | $72,970 | $112,397 |
| 2016 | $2,202 | $178,172 | $70,138 | $108,034 |
| 2015 | $2,116 | $175,497 | $69,085 | $106,412 |
| 2014 | $2,107 | $172,060 | $67,732 | $104,328 |
Source: Public Records
Map
Nearby Homes
- 5857 E Mezzanine Way
- 3317 Ocana Ave
- 5704 E Killdee St
- 5837 E Gossamer St
- 3034 Ocana Ave
- 5530 E Pageantry St
- 6136 E Rosebay St
- 5346 E Flagstone St
- 6152 E Rosebay St
- 3635 Woodruff Ave
- 5320 E Pavo St
- 6128 E Conant St
- 3114 Hackett Ave
- 5640 E Deborah St
- 3635 Conquista Ave
- 3738 Gondar Ave
- 6442 E Pageantry St
- 5433 E Brittain St
- 3675 Palo Verde Ave
- 3240 Clark Ave
- 5808 E Lanai St
- 5764 E Lanai St
- 5803 E Mezzanine Way
- 5814 E Lanai St
- 5760 E Lanai St
- 5809 E Mezzanine Way
- 5767 E Mezzanine Way
- 5813 E Mezzanine Way
- 5761 E Mezzanine Way
- 5803 E Lanai St
- 5809 E Lanai St
- 5818 E Lanai St
- 5754 E Lanai St
- 5765 E Lanai St
- 5815 E Lanai St
- 5819 E Mezzanine Way
- 5755 E Mezzanine Way
- 5759 E Lanai St
- 5824 E Lanai St
- 5748 E Lanai St
Your Personal Tour Guide
Ask me questions while you tour the home.