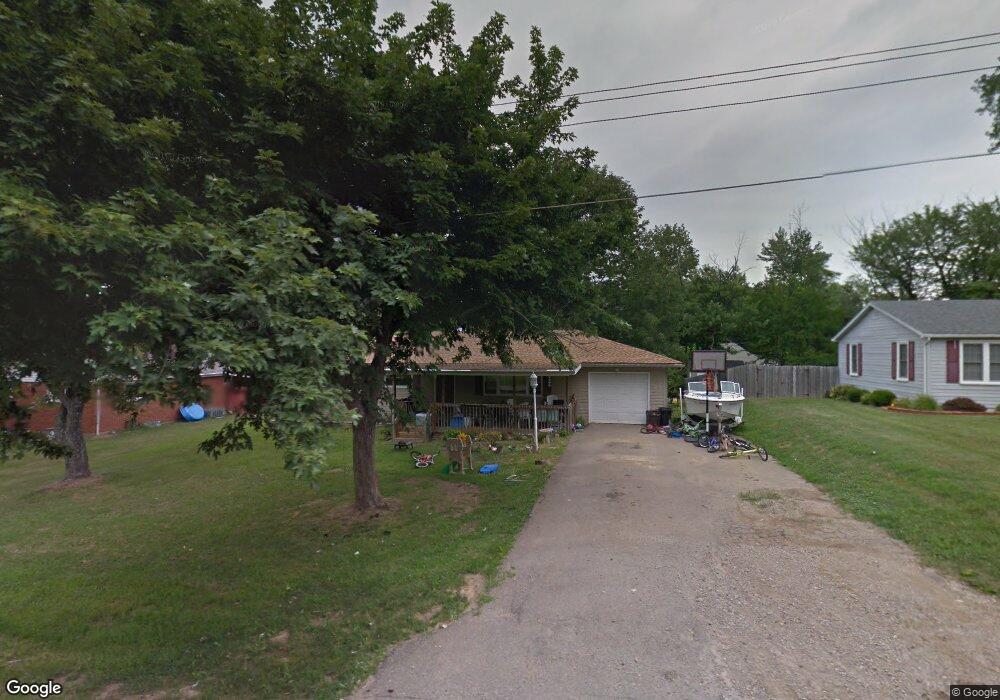
5802 Lynn St Franklin, OH 45005
Estimated Value: $198,000 - $238,000
3
Beds
1
Bath
1,144
Sq Ft
$185/Sq Ft
Est. Value
About This Home
This home is located at 5802 Lynn St, Franklin, OH 45005 and is currently estimated at $211,288, approximately $184 per square foot. 5802 Lynn St is a home located in Warren County with nearby schools including Franklin High School, Summit Academy Community School for Alternative Learners - Middletown, and Summit Academy Secondary School - Middletown.
Ownership History
Date
Name
Owned For
Owner Type
Purchase Details
Closed on
Feb 26, 2004
Sold by
Lykins Jeffrey and Lykins Dorothy E
Bought by
Duff Daniel P
Current Estimated Value
Home Financials for this Owner
Home Financials are based on the most recent Mortgage that was taken out on this home.
Original Mortgage
$70,080
Outstanding Balance
$31,645
Interest Rate
5.74%
Mortgage Type
Purchase Money Mortgage
Estimated Equity
$179,643
Purchase Details
Closed on
Nov 2, 1995
Sold by
Derosett Timothy V
Bought by
Hilton Dorothy E
Home Financials for this Owner
Home Financials are based on the most recent Mortgage that was taken out on this home.
Original Mortgage
$79,448
Interest Rate
7.61%
Mortgage Type
FHA
Purchase Details
Closed on
Aug 29, 1989
Sold by
Hawkins Hawkins and Hawkins Harold G
Bought by
Derosett Derosett and Derosett Timothy V
Create a Home Valuation Report for This Property
The Home Valuation Report is an in-depth analysis detailing your home's value as well as a comparison with similar homes in the area
Home Values in the Area
Average Home Value in this Area
Purchase History
| Date | Buyer | Sale Price | Title Company |
|---|---|---|---|
| Duff Daniel P | $87,600 | -- | |
| Hilton Dorothy E | $79,500 | -- | |
| Derosett Derosett | $59,900 | -- |
Source: Public Records
Mortgage History
| Date | Status | Borrower | Loan Amount |
|---|---|---|---|
| Open | Duff Daniel P | $70,080 | |
| Previous Owner | Hilton Dorothy E | $79,448 |
Source: Public Records
Tax History
| Year | Tax Paid | Tax Assessment Tax Assessment Total Assessment is a certain percentage of the fair market value that is determined by local assessors to be the total taxable value of land and additions on the property. | Land | Improvement |
|---|---|---|---|---|
| 2025 | $2,172 | $49,200 | $15,080 | $34,120 |
| 2024 | $2,172 | $49,200 | $15,080 | $34,120 |
| 2023 | $1,815 | $36,984 | $7,910 | $29,074 |
| 2022 | $1,774 | $36,985 | $7,910 | $29,075 |
| 2021 | $1,675 | $36,985 | $7,910 | $29,075 |
| 2020 | $1,614 | $31,343 | $6,703 | $24,640 |
| 2019 | $1,458 | $31,343 | $6,703 | $24,640 |
| 2018 | $1,449 | $31,343 | $6,703 | $24,640 |
| 2017 | $1,410 | $27,556 | $5,985 | $21,571 |
| 2016 | $1,440 | $27,556 | $5,985 | $21,571 |
| 2015 | $1,440 | $27,556 | $5,985 | $21,571 |
| 2014 | $1,472 | $27,560 | $5,990 | $21,570 |
| 2013 | $1,251 | $30,850 | $6,700 | $24,150 |
Source: Public Records
Map
Nearby Homes
- 5845 Manchester Rd
- 5744 Lynn St
- 25 Timber Creek Dr
- 65 Timber Creek Dr
- 100 Pleasant Hill Blvd
- 5757 S Dixie Hwy
- 6323 Shaker Rd
- 5696 Woodcreek Dr
- 6759 Manchester Rd
- 5925 Millbrook Dr
- 6334 Bevis Ln
- 5667 Woodcreek Dr
- 6633 Rivulet Dr
- 6645 Rivulet Dr
- 5865 Hayden Dr
- 6777 Crystal Harbour Dr
- 6006 Tributary Park
- 4650 Shaker Rd
- 4640 Shaker Rd
- 5760 Autumn Dr
Your Personal Tour Guide
Ask me questions while you tour the home.