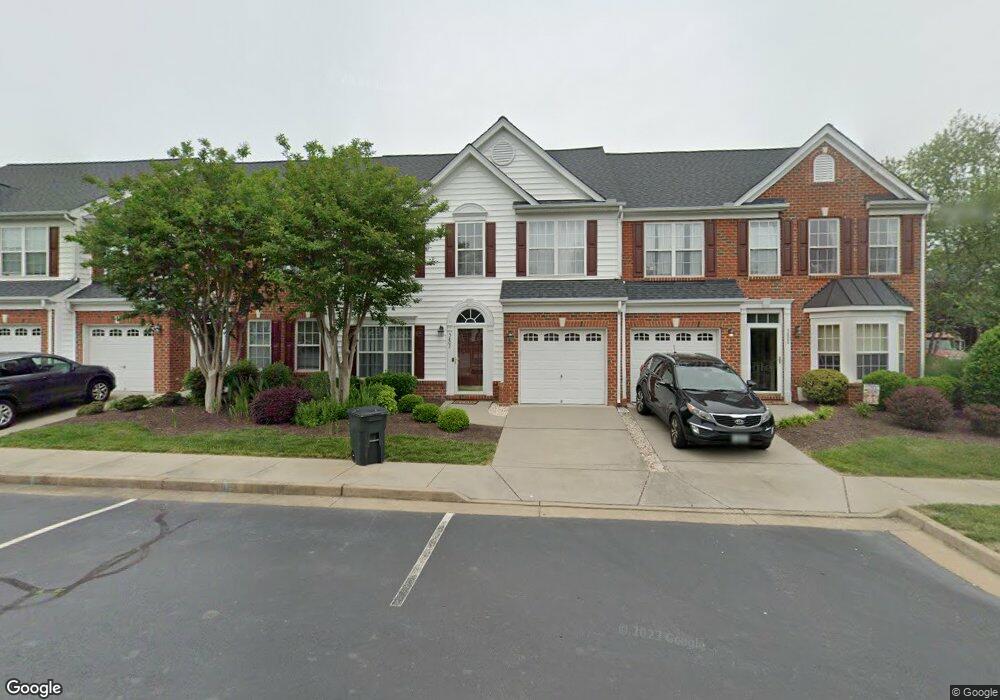
5802 Park Creste Dr Unit 2 Glen Allen, VA 23059
Twin Hickory NeighborhoodEstimated Value: $455,000 - $479,866
3
Beds
3
Baths
2,000
Sq Ft
$232/Sq Ft
Est. Value
About This Home
This home is located at 5802 Park Creste Dr Unit 2, Glen Allen, VA 23059 and is currently estimated at $464,717, approximately $232 per square foot. 5802 Park Creste Dr Unit 2 is a home located in Henrico County with nearby schools including Twin Hickory Elementary School, Holman Middle School, and Deep Run High School.
Ownership History
Date
Name
Owned For
Owner Type
Purchase Details
Closed on
Feb 10, 2011
Sold by
White Sub Tr Samuel I and Ensley Laruth A
Bought by
Federal Home Loan Mortgage Corporation
Current Estimated Value
Purchase Details
Closed on
Sep 25, 2007
Sold by
U S Bank Nat'L Assn
Bought by
Easley Laruth A
Home Financials for this Owner
Home Financials are based on the most recent Mortgage that was taken out on this home.
Original Mortgage
$243,000
Interest Rate
6.65%
Mortgage Type
New Conventional
Purchase Details
Closed on
Jun 2, 2005
Sold by
Nvr Inc
Bought by
Bartol Deborah
Home Financials for this Owner
Home Financials are based on the most recent Mortgage that was taken out on this home.
Original Mortgage
$248,420
Interest Rate
5.73%
Mortgage Type
New Conventional
Create a Home Valuation Report for This Property
The Home Valuation Report is an in-depth analysis detailing your home's value as well as a comparison with similar homes in the area
Home Values in the Area
Average Home Value in this Area
Purchase History
| Date | Buyer | Sale Price | Title Company |
|---|---|---|---|
| Federal Home Loan Mortgage Corporation | $240,000 | -- | |
| Easley Laruth A | $243,000 | -- | |
| Bartol Deborah | $276,023 | -- |
Source: Public Records
Mortgage History
| Date | Status | Borrower | Loan Amount |
|---|---|---|---|
| Previous Owner | Easley Laruth A | $243,000 | |
| Previous Owner | Bartol Deborah | $248,420 |
Source: Public Records
Tax History Compared to Growth
Tax History
| Year | Tax Paid | Tax Assessment Tax Assessment Total Assessment is a certain percentage of the fair market value that is determined by local assessors to be the total taxable value of land and additions on the property. | Land | Improvement |
|---|---|---|---|---|
| 2025 | $3,742 | $418,400 | $90,000 | $328,400 |
| 2024 | $3,742 | $399,600 | $90,000 | $309,600 |
| 2023 | $3,397 | $399,600 | $90,000 | $309,600 |
| 2022 | $3,081 | $362,500 | $90,000 | $272,500 |
| 2021 | $2,737 | $308,700 | $70,000 | $238,700 |
| 2020 | $2,686 | $308,700 | $70,000 | $238,700 |
| 2019 | $2,581 | $296,700 | $70,000 | $226,700 |
| 2018 | $2,478 | $284,800 | $70,000 | $214,800 |
| 2017 | $2,391 | $274,800 | $70,000 | $204,800 |
| 2016 | $2,321 | $266,800 | $62,000 | $204,800 |
| 2015 | $2,270 | $260,900 | $62,000 | $198,900 |
| 2014 | $2,270 | $260,900 | $62,000 | $198,900 |
Source: Public Records
Map
Nearby Homes
- 10605 Gate House Ct
- 0 Manakin Rd Unit VAGO2000320
- 11408 Maple Hill Place
- 4905 Old Millrace Place
- 5525 Barnsley Terrace
- 12008 Stable Ridge Terrace
- 5835 Shady Hills Way
- 5132 Park Commons Loop
- 11012 Ellis Meadows Ln
- 5004 Parkcrest Ct
- 11944 Belmont Park Ct
- 5012 Park Commons Loop
- 11141 Opaca Ln
- 5614 Benoni Ct
- 12109 Oxford Landing Dr Unit 104
- 12109 Oxford Landing Dr Unit 201
- 12109 Oxford Landing Dr Unit 102
- 5824 Ketterley Row
- 11532 Saddleridge Rd
- 5046 Willows Green Rd
- 5802 Park Creste Dr
- 5804 Park Creste Dr
- 5800 Park Creste Dr
- 5800 Park Creste Dr Unit END
- 5806 Park Creste Dr
- 5808 Park Creste Dr
- 5803 Gate House Dr
- 5803 Gate House Dr
- 5803 Gate House Dr Unit 5803
- 5801 Gate House Dr
- 5801 Gate House Dr
- 5801 Gate House Dr Unit 5801
- 5801 Gate House Dr Unit 1
- 5805 Gate House Dr
- 5805 Gate House Dr
- 5807 Gate House Dr
- 5807 Gate House Dr Unit 5807
- 5810 Park Creste Dr
- 5810 Park Creste Dr Unit none
- 5809 Gate House Dr