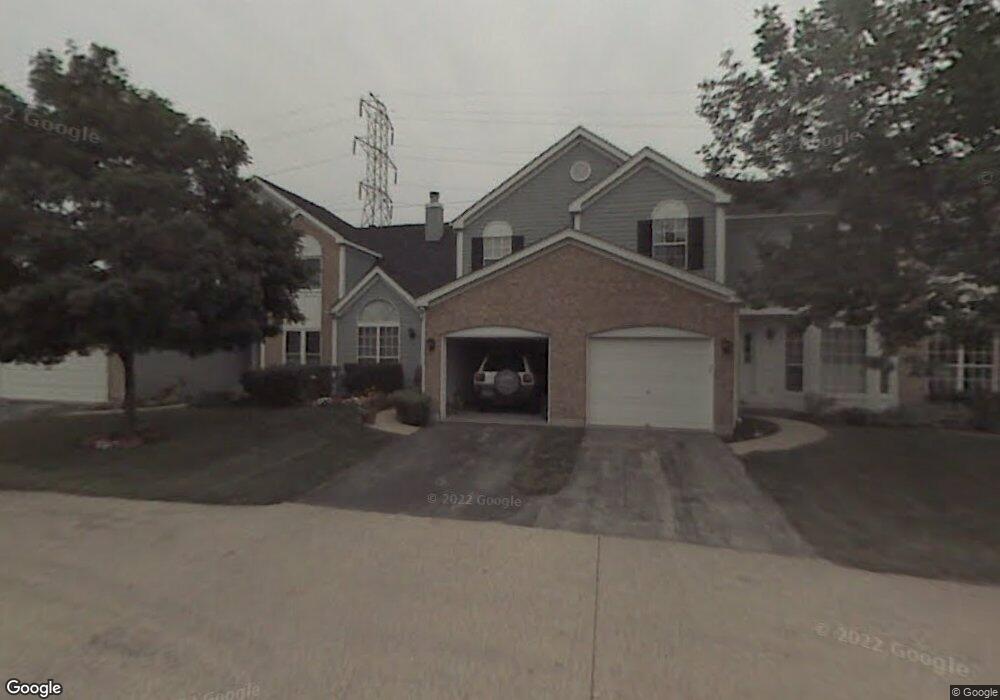
5803 Oxford Cir Gurnee, IL 60031
Estimated Value: $280,000 - $292,000
3
Beds
2
Baths
1,548
Sq Ft
$185/Sq Ft
Est. Value
About This Home
This home is located at 5803 Oxford Cir, Gurnee, IL 60031 and is currently estimated at $286,371, approximately $184 per square foot. 5803 Oxford Cir is a home located in Lake County with nearby schools including Woodland Primary School, Woodland Intermediate School, and Woodland Elementary School.
Ownership History
Date
Name
Owned For
Owner Type
Purchase Details
Closed on
Dec 6, 2002
Sold by
Juco Antonio P and Juco Arlene M
Bought by
Juco Antonio P and Juco Arlene D
Current Estimated Value
Home Financials for this Owner
Home Financials are based on the most recent Mortgage that was taken out on this home.
Original Mortgage
$105,000
Interest Rate
5.76%
Purchase Details
Closed on
Mar 26, 1998
Sold by
Juco Antonio P
Bought by
Juco Antonio P and Juco Arlene M
Home Financials for this Owner
Home Financials are based on the most recent Mortgage that was taken out on this home.
Original Mortgage
$108,500
Interest Rate
7.09%
Purchase Details
Closed on
Aug 8, 1995
Sold by
Powell Joyce L
Bought by
Juco Antonio P
Home Financials for this Owner
Home Financials are based on the most recent Mortgage that was taken out on this home.
Original Mortgage
$111,094
Interest Rate
5.5%
Mortgage Type
FHA
Create a Home Valuation Report for This Property
The Home Valuation Report is an in-depth analysis detailing your home's value as well as a comparison with similar homes in the area
Home Values in the Area
Average Home Value in this Area
Purchase History
| Date | Buyer | Sale Price | Title Company |
|---|---|---|---|
| Juco Antonio P | -- | -- | |
| Juco Antonio P | -- | Chicago Title Insurance Co | |
| Juco Antonio P | $112,000 | -- |
Source: Public Records
Mortgage History
| Date | Status | Borrower | Loan Amount |
|---|---|---|---|
| Closed | Juco Antonio P | $105,000 | |
| Closed | Juco Antonio P | $108,500 | |
| Closed | Juco Antonio P | $111,094 |
Source: Public Records
Tax History Compared to Growth
Tax History
| Year | Tax Paid | Tax Assessment Tax Assessment Total Assessment is a certain percentage of the fair market value that is determined by local assessors to be the total taxable value of land and additions on the property. | Land | Improvement |
|---|---|---|---|---|
| 2024 | $5,266 | $78,478 | $10,560 | $67,918 |
| 2023 | $5,037 | $68,736 | $9,249 | $59,487 |
| 2022 | $5,037 | $61,840 | $8,179 | $53,661 |
| 2021 | $4,525 | $59,359 | $7,851 | $51,508 |
| 2020 | $4,825 | $57,900 | $7,658 | $50,242 |
| 2019 | $4,682 | $56,219 | $7,436 | $48,783 |
| 2018 | $4,476 | $54,709 | $3,962 | $50,747 |
| 2017 | $4,423 | $53,141 | $3,848 | $49,293 |
| 2016 | $4,374 | $50,775 | $3,677 | $47,098 |
| 2015 | $4,246 | $48,155 | $3,487 | $44,668 |
| 2014 | $3,893 | $44,904 | $3,440 | $41,464 |
| 2012 | $4,314 | $45,248 | $3,466 | $41,782 |
Source: Public Records
Map
Nearby Homes
- 1848 Princeton Ct
- 1896 Windsor Ct
- 1795 Newport Ct
- 2105 Lawson Blvd
- 1556 Yew Ct
- 5315 Cypress Cir
- 1391 Sherwood Ct
- 5229 Beechwood Ave
- 0 Tri State Pkwy
- 36537 N Fox Hill Dr
- 5205 Notting Hill Rd
- 5169 Pembrook Ct Unit 20A
- 1999 N Fuller Rd
- 35861 N Fuller Rd
- 5136 Cheshire Rd Unit 5136
- 36625 N Kimberwick Ln
- 1554 Deer Run Rd
- 36396 N Skokie Hwy
- 16655 W Applewood Ct
- 15860 W Thornapple Ln
- 5797 Oxford Cir
- 5815 Oxford Cir
- 1824 Princeton Ct Unit 1
- 1830 Princeton Ct
- 5800 Oxford Cir
- 5806 Oxford Cir
- 1836 Princeton Ct
- 5812 Oxford Cir
- 5821 Oxford Cir Unit 2A
- 5827 Oxford Cir
- 1842 Princeton Ct Unit 1
- 5818 Oxford Cir
- 5830 Oxford Cir
- 5824 Oxford Cir
- 5795 Delaware Ave
- 5801 Delaware Ave
- 1854 Princeton Ct
- 5807 Delaware Ave
- 1827 Princeton Ct Unit 1
- 5813 Delaware Ave