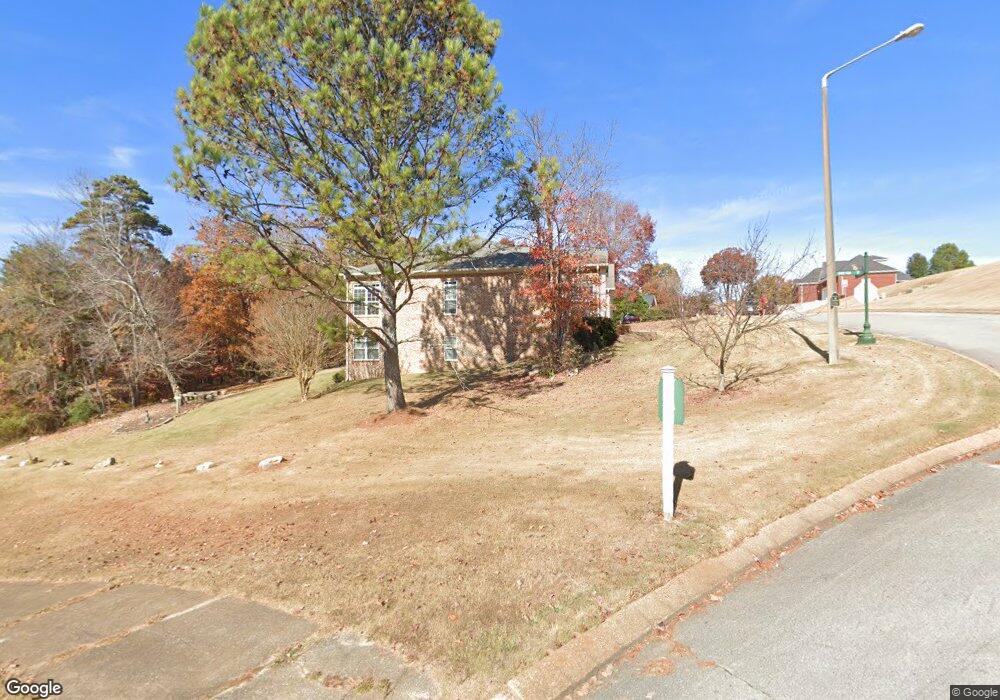
5803 Players Ct Unit 4 Chattanooga, TN 37416
Estimated Value: $705,000 - $808,000
--
Bed
1
Bath
2,872
Sq Ft
$263/Sq Ft
Est. Value
About This Home
This home is located at 5803 Players Ct Unit 4, Chattanooga, TN 37416 and is currently estimated at $754,256, approximately $262 per square foot. 5803 Players Ct Unit 4 is a home located in Hamilton County with nearby schools including Harrison Elementary School, Brown Middle School, and Central High School.
Ownership History
Date
Name
Owned For
Owner Type
Purchase Details
Closed on
Jun 14, 2024
Sold by
Stroupe James Lee and Stroupe Cynthia Leigh
Bought by
Bush Matthew and Bush Amanda
Current Estimated Value
Home Financials for this Owner
Home Financials are based on the most recent Mortgage that was taken out on this home.
Original Mortgage
$455,000
Outstanding Balance
$441,693
Interest Rate
7.22%
Mortgage Type
New Conventional
Estimated Equity
$312,563
Purchase Details
Closed on
Nov 25, 2020
Sold by
Stroupe James Lee and Stroupe James L
Bought by
Stroupe Cynthia Leigh
Home Financials for this Owner
Home Financials are based on the most recent Mortgage that was taken out on this home.
Original Mortgage
$360,000
Interest Rate
2.8%
Mortgage Type
New Conventional
Purchase Details
Closed on
Apr 20, 2010
Sold by
Stroupe Patty A
Bought by
Stroupe James Lee
Purchase Details
Closed on
May 29, 2007
Sold by
Shumaker Patricia B
Bought by
Stroupe James L and Stroupe Patty A
Create a Home Valuation Report for This Property
The Home Valuation Report is an in-depth analysis detailing your home's value as well as a comparison with similar homes in the area
Home Values in the Area
Average Home Value in this Area
Purchase History
| Date | Buyer | Sale Price | Title Company |
|---|---|---|---|
| Bush Matthew | $795,000 | Foothills Title | |
| Stroupe Cynthia Leigh | -- | First Choice Title Inc | |
| Stroupe James Lee | -- | None Available | |
| Stroupe James L | $35,000 | Title Escrow Chattanooga Inc |
Source: Public Records
Mortgage History
| Date | Status | Borrower | Loan Amount |
|---|---|---|---|
| Open | Bush Matthew | $455,000 | |
| Previous Owner | Stroupe Cynthia Leigh | $360,000 |
Source: Public Records
Tax History Compared to Growth
Tax History
| Year | Tax Paid | Tax Assessment Tax Assessment Total Assessment is a certain percentage of the fair market value that is determined by local assessors to be the total taxable value of land and additions on the property. | Land | Improvement |
|---|---|---|---|---|
| 2024 | $2,918 | $130,425 | $0 | $0 |
| 2023 | $2,927 | $130,425 | $0 | $0 |
| 2022 | $2,927 | $130,425 | $0 | $0 |
| 2021 | $2,927 | $130,425 | $0 | $0 |
| 2020 | $2,901 | $104,600 | $0 | $0 |
| 2019 | $2,901 | $104,600 | $0 | $0 |
| 2018 | $2,901 | $104,600 | $0 | $0 |
| 2017 | $2,901 | $104,600 | $0 | $0 |
| 2016 | $2,857 | $0 | $0 | $0 |
| 2015 | $2,857 | $103,000 | $0 | $0 |
| 2014 | $2,857 | $0 | $0 | $0 |
Source: Public Records
Map
Nearby Homes
- 7111 River Run Dr
- 5710 Topsail Greens Dr
- 7035 Glover Rd
- 5914 Rainbow Springs Dr
- 5041 Shoals Ln
- 5236 Abigail Ln
- 6737 Glover Rd
- 7551 Foster Hixson Cemetery Rd
- 6725 Harbor Terrace
- 6113 Shadyway Ln
- 6517 Shelter Cove Dr
- 6108 Shadyway Ln
- 5900 Hickory Hill Dr
- 5916 Hickory Hill Dr
- 6434 Waconda Point Rd
- 1820 Rock Bluff Rd
- 6591 Chipmunk Dr
- 5821 Quail Hollow Cir
- 1800 Mountain Bay Dr
- 1705 Sea Gull Ln
- 5803 Players Ct
- 5807 Players Ct
- 5802 Players Ct
- 5812 Players Ct
- 5813 Players Ct
- 5818 Players Ct Unit 4
- 5817 Players Ct
- 5817 Players Ct Unit 4
- 7128 River Run Dr
- 7213 River Run Dr
- 7208 River Run Dr
- 7127 River Run Dr
- 7547 Tee Way Cir
- 7547 Tee Way Cir Unit 5
- 7502 Tee Way Cir Unit 4
- 7502 Tee Way Cir
- 5821 Players Ct
- 5822 Players Ct
- 7217 River Run Dr
- 7124 River Run Dr