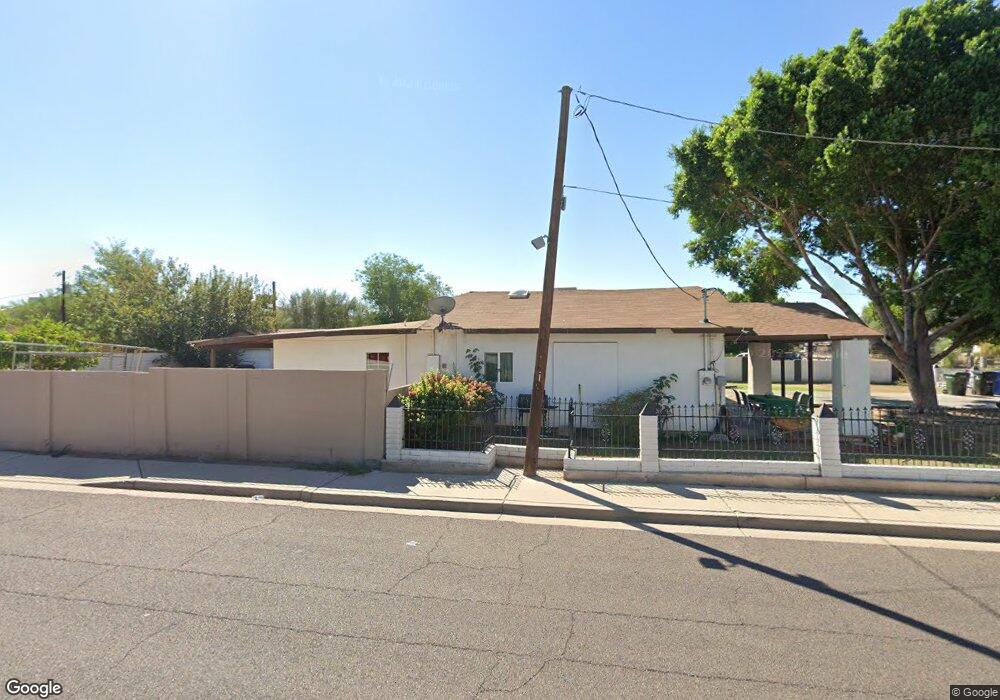
5803 S 3rd St Phoenix, AZ 85040
South Mountain NeighborhoodEstimated Value: $301,000 - $368,000
--
Bed
1
Bath
1,411
Sq Ft
$233/Sq Ft
Est. Value
About This Home
This home is located at 5803 S 3rd St, Phoenix, AZ 85040 and is currently estimated at $329,374, approximately $233 per square foot. 5803 S 3rd St is a home located in Maricopa County with nearby schools including John F. Kennedy Elementary School, C O Greenfield School, and South Mountain High School.
Ownership History
Date
Name
Owned For
Owner Type
Purchase Details
Closed on
Sep 25, 2024
Sold by
Gutierrez Jorge and Gutierrez Grisol
Bought by
Cruz Jose Antonio Apae
Current Estimated Value
Home Financials for this Owner
Home Financials are based on the most recent Mortgage that was taken out on this home.
Original Mortgage
$340,000
Outstanding Balance
$336,519
Interest Rate
6.49%
Mortgage Type
Seller Take Back
Estimated Equity
-$7,145
Purchase Details
Closed on
Sep 9, 2024
Sold by
Gutierrez Amarellys Torres
Bought by
Gutierrez Jorge and Gutierrez Grisol
Home Financials for this Owner
Home Financials are based on the most recent Mortgage that was taken out on this home.
Original Mortgage
$340,000
Outstanding Balance
$336,519
Interest Rate
6.49%
Mortgage Type
Seller Take Back
Estimated Equity
-$7,145
Purchase Details
Closed on
Jan 16, 2024
Sold by
Gutierrez Amarellys Torres
Bought by
Gutierrez Jorge and Gutierrez Grisol
Purchase Details
Closed on
Jan 15, 2024
Sold by
Gutierrez Amarellys Torres
Bought by
Gutierrez Jorge and Gutierrez Grisol
Purchase Details
Closed on
Aug 12, 2014
Sold by
Ramos Jorge Gutierrez
Bought by
Torres Amarallys Gutierrez
Create a Home Valuation Report for This Property
The Home Valuation Report is an in-depth analysis detailing your home's value as well as a comparison with similar homes in the area
Home Values in the Area
Average Home Value in this Area
Purchase History
| Date | Buyer | Sale Price | Title Company |
|---|---|---|---|
| Cruz Jose Antonio Apae | $340,000 | Chicago Title Agency | |
| Gutierrez Jorge | -- | Chicago Title Agency | |
| Gutierrez Jorge | -- | None Listed On Document | |
| Gutierrez Jorge | -- | None Listed On Document | |
| Torres Amarallys Gutierrez | -- | None Available |
Source: Public Records
Mortgage History
| Date | Status | Borrower | Loan Amount |
|---|---|---|---|
| Open | Cruz Jose Antonio Apae | $340,000 |
Source: Public Records
Tax History
| Year | Tax Paid | Tax Assessment Tax Assessment Total Assessment is a certain percentage of the fair market value that is determined by local assessors to be the total taxable value of land and additions on the property. | Land | Improvement |
|---|---|---|---|---|
| 2025 | $1,790 | $13,240 | -- | -- |
| 2024 | $1,691 | $12,610 | -- | -- |
| 2023 | $1,691 | $22,400 | $4,480 | $17,920 |
| 2022 | $1,656 | $16,820 | $3,360 | $13,460 |
| 2021 | $575 | $11,860 | $2,370 | $9,490 |
| 2020 | $568 | $11,230 | $2,240 | $8,990 |
| 2019 | $549 | $9,070 | $1,810 | $7,260 |
| 2018 | $533 | $7,710 | $1,540 | $6,170 |
| 2017 | $497 | $5,270 | $1,050 | $4,220 |
| 2016 | $471 | $4,930 | $980 | $3,950 |
| 2015 | $438 | $3,620 | $720 | $2,900 |
Source: Public Records
Map
Nearby Homes
- 406 E Pecan Rd
- 301 E Southern Ave
- 111 E Southern Ave
- 5437 S 4th St
- 506 E Southern Ave
- 5436 S 7th St
- 5233 S Central Ave
- 111 W Chambers St
- 210 W Sunland Ave
- 502 E Roeser Rd
- 17 W Alta Vista Rd
- 6410 S 7th St
- 5011 S 6th Way
- 710 E Atlanta Ave
- 5625 S 9th St
- 5621 S 5th Dr
- 21 E Saint Charles Ave
- 316 W Roeser Rd
- 832 E Roeser Rd
- 245 W Wier Ave
- 5811 S 3rd St
- 5804 S 4th St
- 308 E Hidalgo Ave
- 304 E Hidalgo Ave
- 5802 S 3rd St
- 312 E Hidalgo Ave
- 5819 S 3rd St
- 5819 S 3rd St
- 5812 S 4th St
- 5812 S 4th St
- 5812 S 3rd St
- 316 E Hidalgo Ave
- 5820 S 4th St Unit back
- 5635 S 3rd St
- 5820 S 3rd St
- 211 E Hidalgo Ave
- 5634 S 4th St Unit 4
- 5634 S 4th St
- 5827 S 3rd St
- 5640 S 3rd St
Your Personal Tour Guide
Ask me questions while you tour the home.