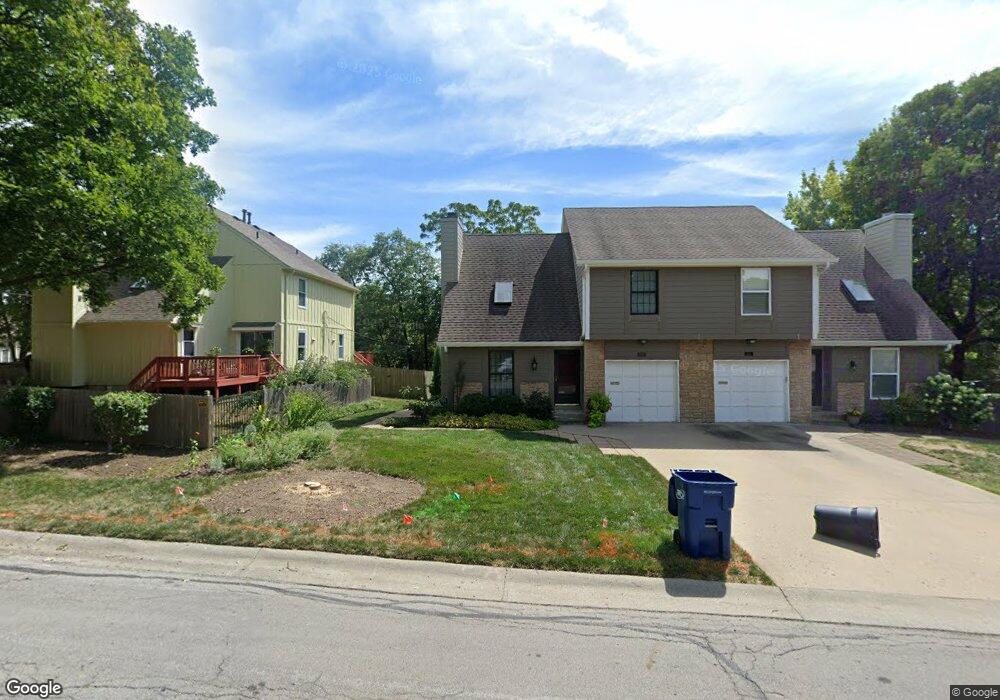
5803 W 57th St Mission, KS 66202
Estimated Value: $238,000 - $309,000
2
Beds
2
Baths
1,220
Sq Ft
$220/Sq Ft
Est. Value
About This Home
This home is located at 5803 W 57th St, Mission, KS 66202 and is currently estimated at $268,565, approximately $220 per square foot. 5803 W 57th St is a home located in Johnson County with nearby schools including Rushton Elementary School, Hocker Grove Middle School, and Shawnee Mission North High School.
Ownership History
Date
Name
Owned For
Owner Type
Purchase Details
Closed on
Jun 2, 2009
Sold by
Ronson Jo Ellen and Frost Martin
Bought by
Lovan Valerie Renee
Current Estimated Value
Purchase Details
Closed on
Nov 14, 2002
Sold by
Salceda Mirta L and Salceda Arturo
Bought by
Ronson Jo Ellen
Home Financials for this Owner
Home Financials are based on the most recent Mortgage that was taken out on this home.
Original Mortgage
$45,000
Interest Rate
6.13%
Purchase Details
Closed on
Mar 28, 2001
Sold by
Shandy Susan K
Bought by
Arocho Mirta L
Home Financials for this Owner
Home Financials are based on the most recent Mortgage that was taken out on this home.
Original Mortgage
$91,350
Interest Rate
6.98%
Mortgage Type
FHA
Create a Home Valuation Report for This Property
The Home Valuation Report is an in-depth analysis detailing your home's value as well as a comparison with similar homes in the area
Home Values in the Area
Average Home Value in this Area
Purchase History
| Date | Buyer | Sale Price | Title Company |
|---|---|---|---|
| Lovan Valerie Renee | -- | Kansas City Title | |
| Ronson Jo Ellen | -- | Security Land Title Company | |
| Arocho Mirta L | -- | Kansas Title Ins Corp |
Source: Public Records
Mortgage History
| Date | Status | Borrower | Loan Amount |
|---|---|---|---|
| Previous Owner | Ronson Jo Ellen | $45,000 | |
| Previous Owner | Arocho Mirta L | $91,350 |
Source: Public Records
Tax History Compared to Growth
Tax History
| Year | Tax Paid | Tax Assessment Tax Assessment Total Assessment is a certain percentage of the fair market value that is determined by local assessors to be the total taxable value of land and additions on the property. | Land | Improvement |
|---|---|---|---|---|
| 2024 | $3,107 | $24,208 | $4,621 | $19,587 |
| 2023 | $3,121 | $23,725 | $4,199 | $19,526 |
| 2022 | $2,733 | $20,689 | $3,816 | $16,873 |
| 2021 | $2,880 | $20,849 | $3,182 | $17,667 |
| 2020 | $2,776 | $19,665 | $2,768 | $16,897 |
| 2019 | $2,644 | $18,515 | $1,850 | $16,665 |
| 2018 | $2,445 | $16,663 | $1,850 | $14,813 |
| 2017 | $2,314 | $15,364 | $1,850 | $13,514 |
| 2016 | $2,315 | $15,226 | $1,850 | $13,376 |
| 2015 | $2,293 | $15,134 | $1,850 | $13,284 |
| 2013 | -- | $13,259 | $1,850 | $11,409 |
Source: Public Records
Map
Nearby Homes
- 5729 Dearborn St
- 5516 Outlook St
- 5543 Maple St
- 5400 W 58th St
- 5431 Woodson Rd
- 5312 W 58th St
- 5434 Maple St
- 5701 Russell St
- 5429 Maple St
- 5940 Nall Ave
- 5806 Russell St
- 5335 Maple St
- 6025 Nall Ave
- 4976 W 60th Terrace
- 5612 W 61st Terrace
- 5504 Glenwood St
- 6219 W 61st Terrace
- 5226 Alder Dr
- 5600 Roe Blvd
- 6141 Walmer St
- 5805 W 57th St
- 5700 Outlook St
- 5702 Outlook St
- 5701 Woodson Rd
- 5708 Outlook St
- 5709 Woodson Rd
- 5642 Outlook St
- 5717 Woodson Rd
- 5638 Outlook St
- 5701 Outlook St
- 5705 Outlook St
- 5709 Outlook St
- 5719 Woodson Rd
- 5715 Outlook St
- 5706 Woodson Rd
- 5901 W 57th St
- 5721 Woodson Rd
- 5710 Woodson Rd
- 5628 Outlook St
- 5902 W 57th St