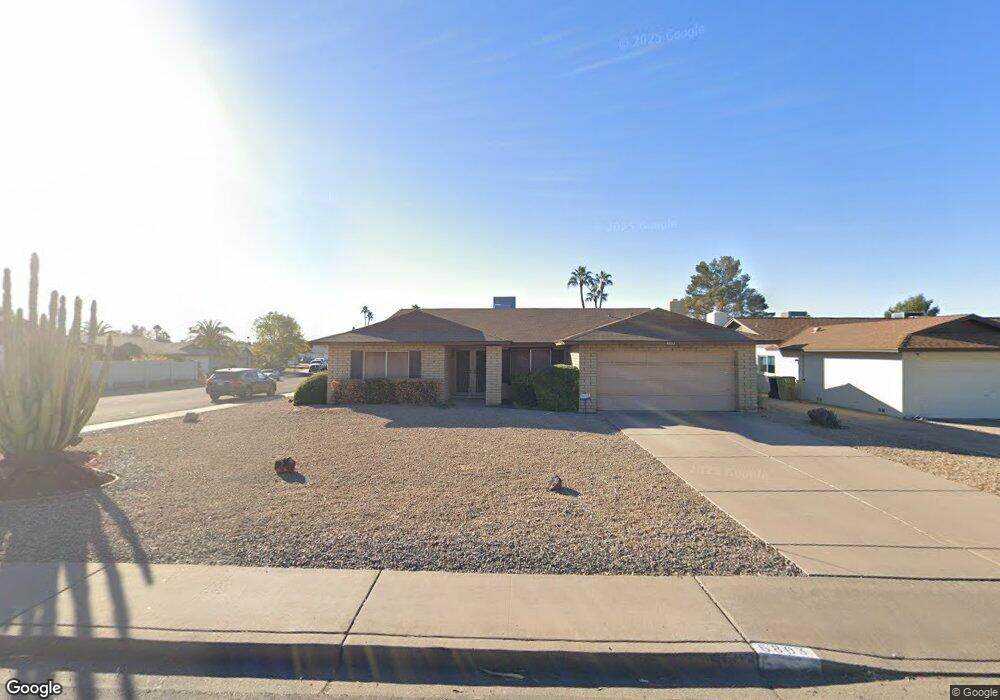
5803 W Cholla St Glendale, AZ 85304
Estimated Value: $334,543 - $460,000
3
Beds
2
Baths
1,950
Sq Ft
$214/Sq Ft
Est. Value
About This Home
This home is located at 5803 W Cholla St, Glendale, AZ 85304 and is currently estimated at $416,886, approximately $213 per square foot. 5803 W Cholla St is a home located in Maricopa County with nearby schools including Desert Palms Elementary School and Ironwood High School.
Ownership History
Date
Name
Owned For
Owner Type
Purchase Details
Closed on
Mar 28, 2024
Sold by
Raymond Vest Mobley Sr Living Trust
Bought by
Raymond Vest Mobley Sr Living Trust and Mobley
Current Estimated Value
Purchase Details
Closed on
Jul 25, 2022
Sold by
Marie Mobley Carol
Bought by
Waters Nick Dana Lawrenc and Waters Michael John
Purchase Details
Closed on
Oct 19, 2004
Sold by
Mobley Raymond V and Mobley Carol Marie
Bought by
Mobley Raymond and Raymond Vest Mobley Sr Living Trust
Purchase Details
Closed on
Aug 7, 2003
Sold by
Stevens Allen Robert Wayne and Stevens Carole Ann
Bought by
Mobley Raymond and Mobley Carol Marie
Purchase Details
Closed on
Feb 24, 1994
Sold by
Bastunas Peter and Bastunas Lorraine F
Bought by
Stevens Allen Robert Wayne and Stevens Carole Ann
Home Financials for this Owner
Home Financials are based on the most recent Mortgage that was taken out on this home.
Original Mortgage
$97,410
Interest Rate
7.38%
Mortgage Type
VA
Create a Home Valuation Report for This Property
The Home Valuation Report is an in-depth analysis detailing your home's value as well as a comparison with similar homes in the area
Home Values in the Area
Average Home Value in this Area
Purchase History
| Date | Buyer | Sale Price | Title Company |
|---|---|---|---|
| Raymond Vest Mobley Sr Living Trust | -- | None Listed On Document | |
| Waters Nick Dana Lawrenc | -- | Nearhood Law Offices Plc | |
| Mobley Raymond | -- | -- | |
| Mobley Raymond | $150,000 | Equity Title Agency Inc | |
| Stevens Allen Robert Wayne | $95,500 | First American Title |
Source: Public Records
Mortgage History
| Date | Status | Borrower | Loan Amount |
|---|---|---|---|
| Previous Owner | Stevens Allen Robert Wayne | $97,410 |
Source: Public Records
Tax History Compared to Growth
Tax History
| Year | Tax Paid | Tax Assessment Tax Assessment Total Assessment is a certain percentage of the fair market value that is determined by local assessors to be the total taxable value of land and additions on the property. | Land | Improvement |
|---|---|---|---|---|
| 2025 | $1,116 | $14,637 | -- | -- |
| 2024 | $1,139 | $13,940 | -- | -- |
| 2023 | $1,139 | $29,550 | $5,910 | $23,640 |
| 2022 | $1,128 | $22,660 | $4,530 | $18,130 |
| 2021 | $1,211 | $20,970 | $4,190 | $16,780 |
| 2020 | $1,229 | $19,500 | $3,900 | $15,600 |
| 2019 | $1,195 | $17,780 | $3,550 | $14,230 |
| 2018 | $1,167 | $16,560 | $3,310 | $13,250 |
| 2017 | $1,175 | $14,680 | $2,930 | $11,750 |
| 2016 | $1,167 | $13,910 | $2,780 | $11,130 |
| 2015 | $1,095 | $13,910 | $2,780 | $11,130 |
Source: Public Records
Map
Nearby Homes
- 11227 N 59th Dr
- 5651 W Mescal St
- 10820 N 57th Dr
- 11840 N 59th Ln
- 5633 W Saguaro Dr
- 5534 W Riviera Dr
- 10803 N 55th Ave
- 5865 W North Ln
- 5432 W Sunnyside Dr
- 5674 W North Ln
- 12316 N 58th Dr
- 12327 N 57th Dr
- 12334 N 58th Dr
- 6210 W Desert Hills Dr
- 10345 N 62nd Ave
- 6319 W Mercer Ln
- 11051 N 53rd Ave
- 5344 W Desert Hills Dr
- 10227 N 56th Dr
- 5407 W North Ln
- 5809 W Cholla St
- 11240 N 58th Ave
- 5767 W Cholla St
- 5815 W Cholla St
- 11243 N 58th Dr
- 11239 N 58th Ave
- 11234 N 58th Ave
- 11402 N 58th Ave
- 11237 N 58th Dr
- 11403 N 58th Dr
- 5821 W Cholla St
- 11233 N 58th Ave
- 11228 N 58th Ave Unit WOW
- 11228 N 58th Ave
- 11408 N 58th Ave
- 11231 N 58th Dr
- 11238 N 57th Ln
- 11409 N 58th Dr
- 11244 N 58th Dr
- 11227 N 58th Ave Unit 8