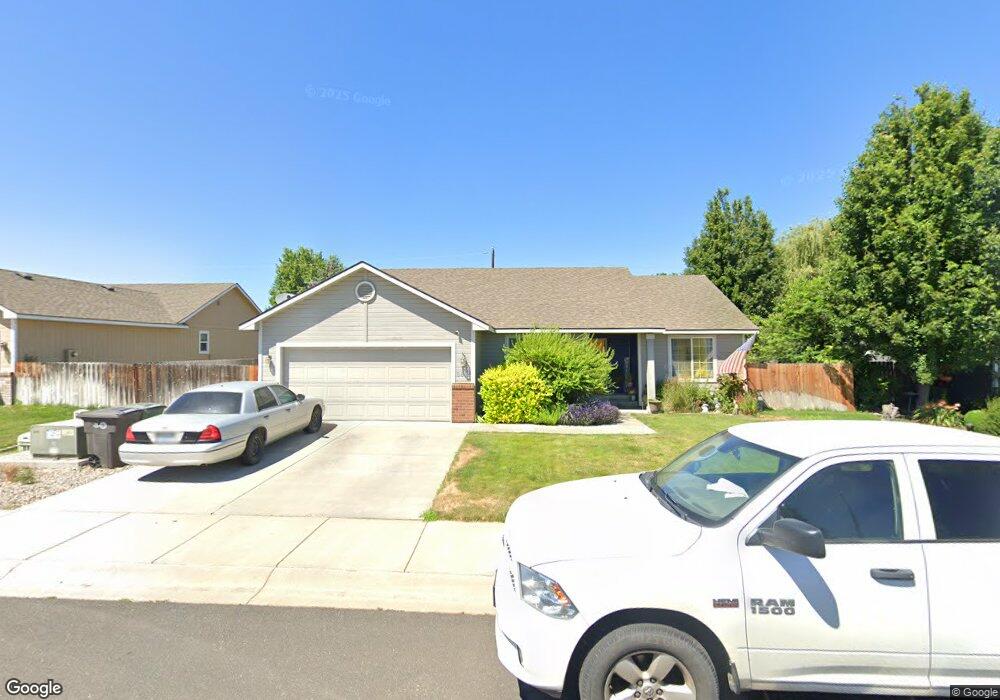
5803 W Whatcom Ave Yakima, WA 98903
West Valley NeighborhoodEstimated Value: $397,089 - $452,000
3
Beds
2
Baths
1,526
Sq Ft
$279/Sq Ft
Est. Value
About This Home
This home is located at 5803 W Whatcom Ave, Yakima, WA 98903 and is currently estimated at $426,022, approximately $279 per square foot. 5803 W Whatcom Ave is a home located in Yakima County with nearby schools including West Valley Middle School, Summitview Elementary School, and West Valley Junior High School.
Ownership History
Date
Name
Owned For
Owner Type
Purchase Details
Closed on
Jul 13, 2021
Sold by
Gerlach Nolan L and Gerlach Alycia K
Bought by
Munoz Alfredo and Munoz Luisa
Current Estimated Value
Home Financials for this Owner
Home Financials are based on the most recent Mortgage that was taken out on this home.
Original Mortgage
$311,253
Outstanding Balance
$282,414
Interest Rate
2.9%
Mortgage Type
FHA
Estimated Equity
$143,608
Purchase Details
Closed on
Jun 24, 2008
Sold by
Sr Homes Llc
Bought by
Gerlach Nolan L and Gerlach Alycia K
Home Financials for this Owner
Home Financials are based on the most recent Mortgage that was taken out on this home.
Original Mortgage
$147,120
Interest Rate
6%
Mortgage Type
Purchase Money Mortgage
Purchase Details
Closed on
Nov 20, 2007
Sold by
Cottonwood Partners Llc
Bought by
Sr Homes Llc
Create a Home Valuation Report for This Property
The Home Valuation Report is an in-depth analysis detailing your home's value as well as a comparison with similar homes in the area
Home Values in the Area
Average Home Value in this Area
Purchase History
| Date | Buyer | Sale Price | Title Company |
|---|---|---|---|
| Munoz Alfredo | $317,000 | Valley Title Guarantee | |
| Gerlach Nolan L | $183,900 | First American Title Company | |
| Sr Homes Llc | $137,528 | First American Title Comp |
Source: Public Records
Mortgage History
| Date | Status | Borrower | Loan Amount |
|---|---|---|---|
| Open | Munoz Alfredo | $311,253 | |
| Previous Owner | Gerlach Nolan L | $147,120 |
Source: Public Records
Tax History Compared to Growth
Tax History
| Year | Tax Paid | Tax Assessment Tax Assessment Total Assessment is a certain percentage of the fair market value that is determined by local assessors to be the total taxable value of land and additions on the property. | Land | Improvement |
|---|---|---|---|---|
| 2025 | $3,307 | $367,100 | $68,700 | $298,400 |
| 2023 | $3,391 | $304,400 | $44,200 | $260,200 |
| 2022 | $3,441 | $312,000 | $47,400 | $264,600 |
| 2021 | $3,108 | $267,700 | $47,400 | $220,300 |
| 2019 | $2,389 | $210,600 | $47,400 | $163,200 |
| 2018 | $2,541 | $190,900 | $47,400 | $143,500 |
| 2017 | $2,299 | $181,000 | $47,400 | $133,600 |
| 2016 | $2,502 | $185,350 | $53,750 | $131,600 |
| 2015 | $2,502 | $191,250 | $53,750 | $137,500 |
| 2014 | $2,502 | $191,250 | $53,750 | $137,500 |
| 2013 | $2,502 | $191,250 | $53,750 | $137,500 |
Source: Public Records
Map
Nearby Homes
- 5705 W Whatcom Ave
- 2017 S 59th Ave
- 5901 Coolidge Rd
- 6109 Cottonwood Loop
- 6402 Fremont Dr
- The Hudson Plan at Marylyn Place
- 0 Ahtanum Rd
- The Alderwood Plan at Marylyn Place
- The Pacific Plan at Marylyn Place
- The Snowbrush Plan at Marylyn Place
- The Timberline Plan at Marylyn Place
- The Edgewood Plan at Marylyn Place
- The Waterbrook Plan at Marylyn Place
- The Clearwater Plan at Marylyn Place
- The Keizer Plan at Marylyn Place
- 2124 S 67th Ave
- 5705 Woolsey Rd
- 5810 W Larch Ave
- 5704 W Larch Ave
- 5606 W Larch Ave
- 5801 W Whatcom Ave
- 5805 W Whatcom Ave
- 5805 W Whatcom Ave Unit 26
- 2010 58th Ave
- 5807 W Whatcom Ave Unit 25
- 5710 W Washington Ave
- 2011 S 59th Ave
- 2011 58th Ave
- 2012 S 58th Ave
- 5703 W Whatcom Ave
- 5703 W Whatcom Ave Unit 30
- 5901 W Whatcom Ave
- 5901 W Whatcom Ave Unit 24
- 2013 58th Ave
- 2013 S 59th Ave
- 2010 S 57th Ave Unit 13
- 2014 58th Ave
- 2010 S 57th Ave
- 5701 W Whatcom Ave
- 5903 W Whatcom Ave