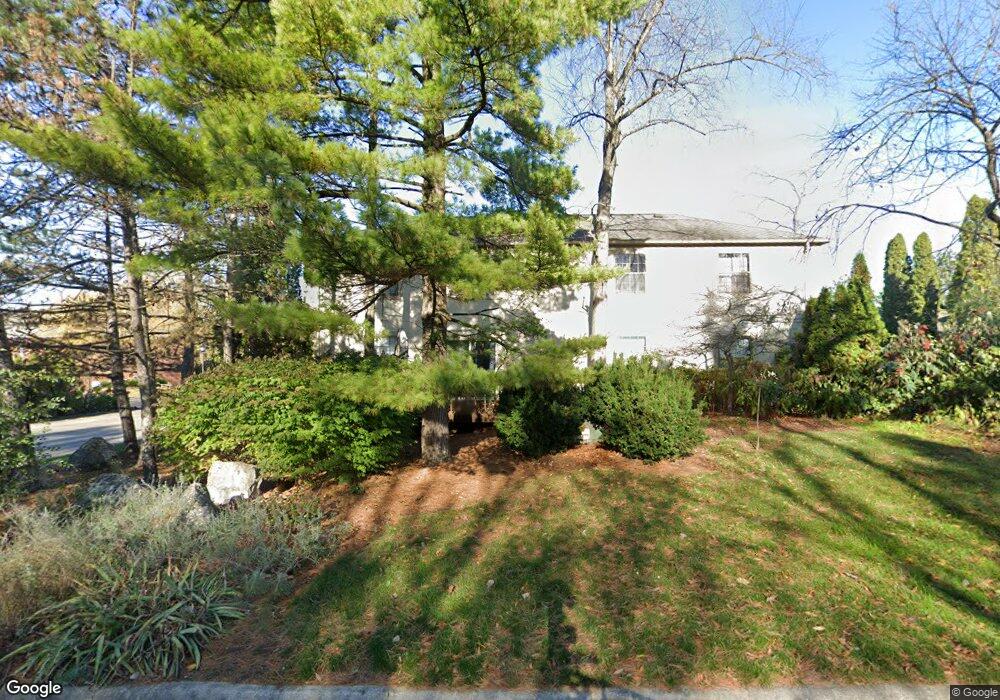
5803 Wendcliff Dr Unit 5801 Columbus, OH 43231
Northern Woods NeighborhoodEstimated Value: $173,000 - $197,780
3
Beds
2
Baths
1,291
Sq Ft
$147/Sq Ft
Est. Value
About This Home
This home is located at 5803 Wendcliff Dr Unit 5801, Columbus, OH 43231 and is currently estimated at $189,945, approximately $147 per square foot. 5803 Wendcliff Dr Unit 5801 is a home located in Franklin County with nearby schools including Huber Ridge Elementary School, Walnut Springs Middle School, and Westerville Central High School.
Ownership History
Date
Name
Owned For
Owner Type
Purchase Details
Closed on
May 31, 2001
Sold by
Wiltshire Martin Reina M
Bought by
Gockenbach Malinda M
Current Estimated Value
Home Financials for this Owner
Home Financials are based on the most recent Mortgage that was taken out on this home.
Original Mortgage
$65,200
Interest Rate
10%
Mortgage Type
Purchase Money Mortgage
Purchase Details
Closed on
Apr 20, 2001
Sold by
Rh Communities Venture I Llc
Bought by
Wiltshire Martin Reina M
Home Financials for this Owner
Home Financials are based on the most recent Mortgage that was taken out on this home.
Original Mortgage
$65,200
Interest Rate
10%
Mortgage Type
Purchase Money Mortgage
Purchase Details
Closed on
Feb 26, 1988
Purchase Details
Closed on
Jan 6, 1988
Create a Home Valuation Report for This Property
The Home Valuation Report is an in-depth analysis detailing your home's value as well as a comparison with similar homes in the area
Home Values in the Area
Average Home Value in this Area
Purchase History
| Date | Buyer | Sale Price | Title Company |
|---|---|---|---|
| Gockenbach Malinda M | $93,900 | Chicago Title | |
| Wiltshire Martin Reina M | $93,900 | Chicago Title | |
| -- | -- | -- | |
| -- | -- | -- |
Source: Public Records
Mortgage History
| Date | Status | Borrower | Loan Amount |
|---|---|---|---|
| Previous Owner | Wiltshire Martin Reina M | $65,200 |
Source: Public Records
Tax History Compared to Growth
Tax History
| Year | Tax Paid | Tax Assessment Tax Assessment Total Assessment is a certain percentage of the fair market value that is determined by local assessors to be the total taxable value of land and additions on the property. | Land | Improvement |
|---|---|---|---|---|
| 2024 | $2,341 | $56,770 | $10,500 | $46,270 |
| 2023 | $2,315 | $56,770 | $10,500 | $46,270 |
| 2022 | $1,913 | $38,780 | $5,460 | $33,320 |
| 2021 | $1,932 | $38,780 | $5,460 | $33,320 |
| 2020 | $1,925 | $38,780 | $5,460 | $33,320 |
| 2019 | $1,416 | $29,820 | $4,200 | $25,620 |
| 2018 | $1,475 | $29,820 | $4,200 | $25,620 |
| 2017 | $1,584 | $29,820 | $4,200 | $25,620 |
| 2016 | $1,779 | $33,390 | $4,550 | $28,840 |
| 2015 | $1,675 | $33,390 | $4,550 | $28,840 |
| 2014 | $2,418 | $33,390 | $4,550 | $28,840 |
| 2013 | $1,268 | $35,140 | $4,795 | $30,345 |
Source: Public Records
Map
Nearby Homes
- 2800 Overview Ct Unit 2800B
- 5841 Forest Hills Blvd Unit 5843
- 5678 Great Hall Ct Unit 12C
- 2677-2679 Blossom Ave
- 3001 Cooper Bluff Dr Unit 3001
- 5600 Cartwright Ln Unit 19
- 5681 Oliver St
- 2727 Patrick Ave
- 5670 Oliver St
- 3038 Highcliff Ct
- 2981 Blendon Woods Blvd Unit 983
- 3070 Highcliff Ct Unit 3070
- 3068 Highcliff Ct Unit 3068
- 3129 Rainier Ave
- 3104 Palomar Ave
- 3160 Adirondack Ave
- 3140 Palomar Ave
- 2721 Woodland Trail Dr Unit 2721
- 3194 Adirondack Ave
- 3066 Ravine Pointe Dr Unit 3066
- 5805 Wendcliff Dr Unit 5805B
- 2809 Overview Ct Unit 2809B
- 5800 Wendcliff Dr Unit 5800B
- 5802 Wendcliff Dr Unit 5802
- 5809 Wendcliff Dr Unit 5809C
- 2807 Overview Ct
- 2807 Overview Ct Unit 2807B
- 5811 Wendcliff Dr Unit 5811
- 2810 Overview Ct Unit 2810
- 2812 Overview Ct Unit 2812
- 5808 Wendcliff Dr Unit 5805A
- 5808 Wendcliff Dr Unit 5808A
- 5808 Wendcliff Dr Unit 5808A
- 5806 Wendcliff Dr Unit 5806A
- 3170 Vista View Blvd Unit 3170
- 2806 Overview Ct Unit 2806A
- 2801 Overview Ct Unit B
- 3172 Vista View Blvd Unit 3172
- 3152 Vista View Blvd Unit 3152
- 3150 Vista View Blvd Unit 3150