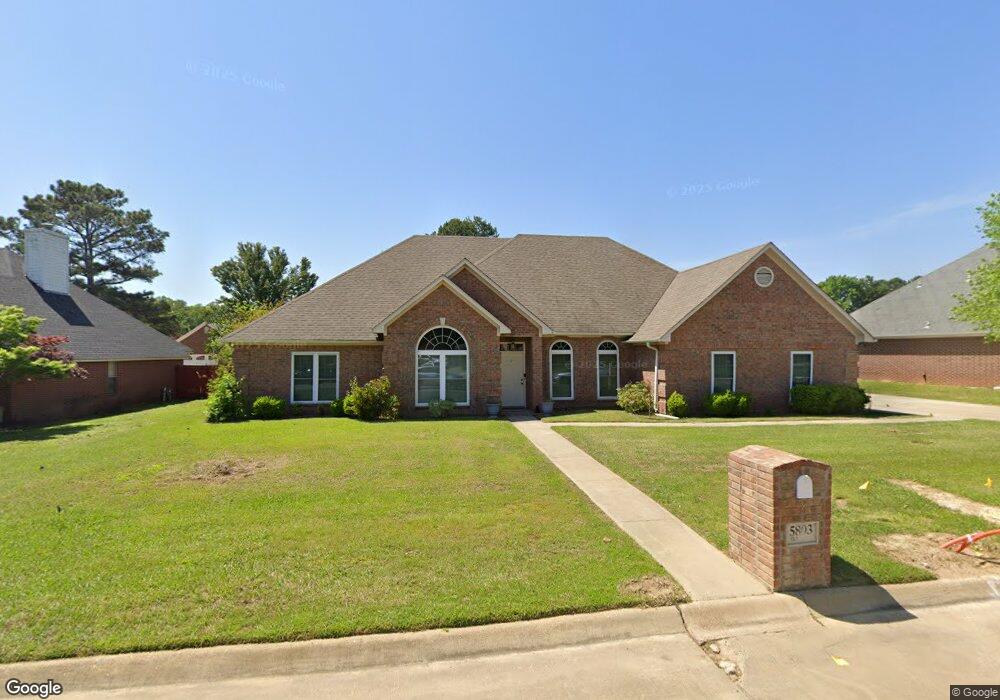
5803 Whitney Ln Texarkana, TX 75503
Estimated Value: $322,893 - $403,000
--
Bed
--
Bath
2,472
Sq Ft
$149/Sq Ft
Est. Value
About This Home
This home is located at 5803 Whitney Ln, Texarkana, TX 75503 and is currently estimated at $367,723, approximately $148 per square foot. 5803 Whitney Ln is a home located in Bowie County with nearby schools including Margaret Fischer Davis Elementary School, Pleasant Grove Intermediate School, and Pleasant Grove Middle School.
Ownership History
Date
Name
Owned For
Owner Type
Purchase Details
Closed on
Apr 1, 2014
Sold by
Mcpherson John David and Mcpherson Melissa Gale
Bought by
Gulledge Brandon B
Current Estimated Value
Home Financials for this Owner
Home Financials are based on the most recent Mortgage that was taken out on this home.
Original Mortgage
$228,779
Outstanding Balance
$173,801
Interest Rate
4.4%
Mortgage Type
FHA
Estimated Equity
$193,922
Purchase Details
Closed on
Aug 8, 2008
Sold by
Nelson Richard A and Nelson Joy J
Bought by
Mcpherson John David
Home Financials for this Owner
Home Financials are based on the most recent Mortgage that was taken out on this home.
Original Mortgage
$170,320
Interest Rate
6.47%
Mortgage Type
Purchase Money Mortgage
Create a Home Valuation Report for This Property
The Home Valuation Report is an in-depth analysis detailing your home's value as well as a comparison with similar homes in the area
Home Values in the Area
Average Home Value in this Area
Purchase History
| Date | Buyer | Sale Price | Title Company |
|---|---|---|---|
| Gulledge Brandon B | -- | Twin City Title | |
| Mcpherson John David | -- | Bowie County Title Llc |
Source: Public Records
Mortgage History
| Date | Status | Borrower | Loan Amount |
|---|---|---|---|
| Open | Gulledge Brandon B | $228,779 | |
| Previous Owner | Mcpherson John David | $170,320 |
Source: Public Records
Tax History Compared to Growth
Tax History
| Year | Tax Paid | Tax Assessment Tax Assessment Total Assessment is a certain percentage of the fair market value that is determined by local assessors to be the total taxable value of land and additions on the property. | Land | Improvement |
|---|---|---|---|---|
| 2025 | $5,771 | $333,455 | $25,000 | $308,455 |
| 2024 | $5,771 | $318,693 | $25,000 | $299,831 |
| 2023 | $6,522 | $289,721 | $0 | $0 |
| 2022 | $6,467 | $281,331 | $25,000 | $256,331 |
| 2021 | $6,262 | $239,439 | $25,000 | $214,439 |
| 2020 | $6,033 | $229,482 | $25,000 | $204,482 |
| 2019 | $5,995 | $222,247 | $25,000 | $197,247 |
| 2018 | $5,763 | $214,843 | $25,000 | $189,843 |
| 2017 | $5,765 | $215,501 | $25,000 | $190,501 |
| 2016 | $5,765 | $215,501 | $25,000 | $190,501 |
| 2015 | $5,610 | $213,688 | $25,000 | $188,688 |
| 2014 | $5,610 | $208,674 | $25,000 | $183,674 |
Source: Public Records
Map
Nearby Homes
- 2 Whitney Cir
- 2905 Landon Ln
- 52 Lanshire Dr
- 6009 Beacon Hill Dr
- 3004 Bethany Ln
- 3003 Kevin Ave
- 3007 Bethany Ln
- 35 Lanshire Dr
- 6131 Summerhill Place
- 6137 Summerhill Place
- 3105 Bethany Ln
- 6106 Ben Burrough Rd
- 6210 Gould Place
- 3103 Crestridge Dr
- 6107 Ben Burrough Rd
- 3104 Bethany Ln
- 3108 Bethany Ln
- 3108 Crestridge Dr
- 5904 Cooks Ln
- 5812 Cooks Ln
- 5805 Whitney Ln
- 2703 Bethany Ln
- 5801 Whitney Ln
- 2704 Landon Ln
- 5806 Whitney Ln
- 2705 Bethany Ln
- 5804 Whitney Ln
- 2706 Landon Ln
- 5808 Whitney Ln
- 5901 Whitney Ln
- 5802 Whitney Ln
- 5701 Whitney Ln
- 2704 Bethany Ln
- 2624 Serenity Ln
- 5902 Whitney Ln
- 2705 Landon Ln
- 2706 Bethany Ln
- 2802 Landon Ln
- 2801 Bethany Ln
- 2622 Serenity Ln