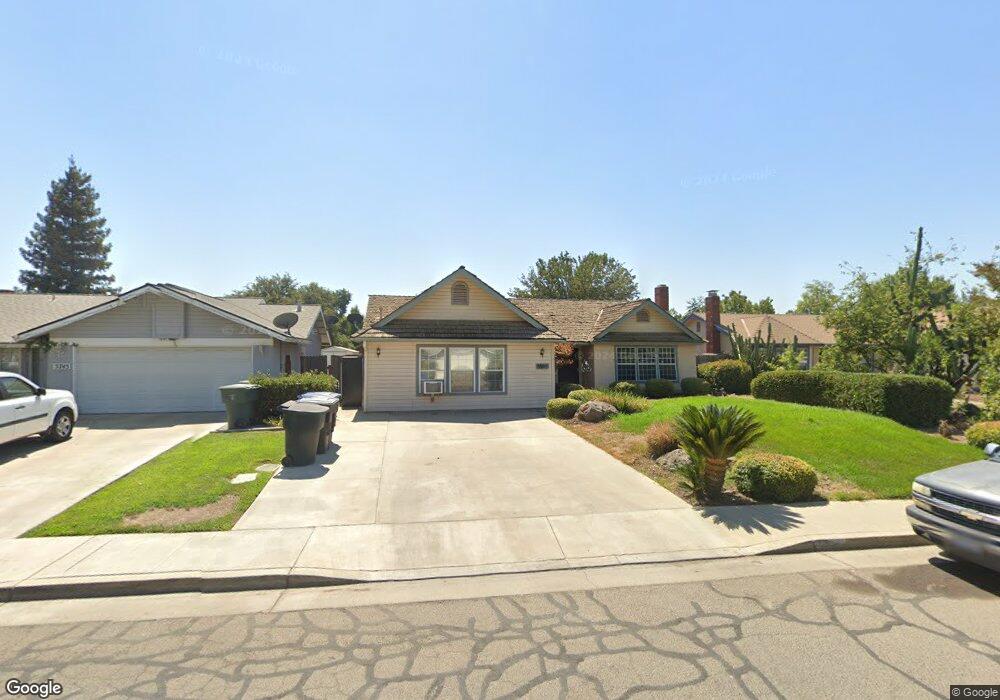
5805 W Howard Ct Visalia, CA 93277
Estimated Value: $419,000 - $540,000
3
Beds
3
Baths
2,031
Sq Ft
$228/Sq Ft
Est. Value
About This Home
This home is located at 5805 W Howard Ct, Visalia, CA 93277 and is currently estimated at $463,319, approximately $228 per square foot. 5805 W Howard Ct is a home located in Tulare County with nearby schools including Veva Blunt Elementary School, La Joya Middle School, and El Diamante High School.
Ownership History
Date
Name
Owned For
Owner Type
Purchase Details
Closed on
Aug 28, 1998
Sold by
Beasley Delores
Bought by
Aguinaga Robert
Current Estimated Value
Purchase Details
Closed on
Sep 26, 1997
Sold by
Beasley Delores
Bought by
Aguinaga Stacy
Purchase Details
Closed on
Apr 7, 1995
Sold by
Beasley John
Bought by
Beasley John and Beasley Delores
Home Financials for this Owner
Home Financials are based on the most recent Mortgage that was taken out on this home.
Original Mortgage
$107,000
Interest Rate
8.9%
Purchase Details
Closed on
Mar 17, 1995
Sold by
Beasley Delores
Bought by
Beasley John and Beasley Delores
Home Financials for this Owner
Home Financials are based on the most recent Mortgage that was taken out on this home.
Original Mortgage
$107,000
Interest Rate
8.9%
Create a Home Valuation Report for This Property
The Home Valuation Report is an in-depth analysis detailing your home's value as well as a comparison with similar homes in the area
Purchase History
| Date | Buyer | Sale Price | Title Company |
|---|---|---|---|
| Aguinaga Robert | -- | -- | |
| Aguinaga Stacy | -- | -- | |
| Beasley John | -- | -- | |
| Beasley John | -- | Old Republic Title Company |
Source: Public Records
Mortgage History
| Date | Status | Borrower | Loan Amount |
|---|---|---|---|
| Previous Owner | Beasley John | $107,000 |
Source: Public Records
Tax History
| Year | Tax Paid | Tax Assessment Tax Assessment Total Assessment is a certain percentage of the fair market value that is determined by local assessors to be the total taxable value of land and additions on the property. | Land | Improvement |
|---|---|---|---|---|
| 2025 | $2,426 | $218,325 | $56,795 | $161,530 |
| 2024 | $2,426 | $214,045 | $55,682 | $158,363 |
| 2023 | $2,346 | $209,849 | $54,591 | $155,258 |
| 2022 | $2,231 | $205,735 | $53,521 | $152,214 |
| 2021 | $2,218 | $201,701 | $52,472 | $149,229 |
| 2020 | $2,199 | $199,633 | $51,934 | $147,699 |
| 2019 | $2,126 | $195,719 | $50,916 | $144,803 |
| 2018 | $2,062 | $191,882 | $49,918 | $141,964 |
| 2017 | $2,029 | $188,119 | $48,939 | $139,180 |
| 2016 | $1,982 | $184,430 | $47,979 | $136,451 |
| 2015 | $1,908 | $181,659 | $47,258 | $134,401 |
| 2014 | $1,908 | $178,100 | $46,332 | $131,768 |
Source: Public Records
Map
Nearby Homes
- 5505 W Tulare Ave Unit 80
- 5505 W Tulare Ave Unit 379
- 5505 W Tulare Ave Unit 113
- 5505 W Tulare Ave Unit 64
- 5505 W Tulare Ave Unit 330
- 5505 W Tulare Spc 73 Ave
- 1521 S Jacques St Unit And55
- 2014 S Tommy Ct
- 1533 S Savannah St Unit Lot 23
- 1533 S Savannah St Unit And23
- 1523 S Bluegrass Ct Unit And45
- 1514 S Bluegrass Ct Unit And49
- 2135 SE Cottonwood Cir
- 2134 SW Cottonwood Cir
- 1537 S Jacques St Unit And 53
- 1529 S Jacques St Unit And54
- 1525 S Savannah St Unit And24
- 6201 W Feemster Ave Unit And64
- 6340 W Howard Ave Unit And29
- 6001 W Mary Ct
- 5815 W Howard Ct
- 5745 W Howard Ct
- 1506 S Cottonwood Ct
- 5825 W Howard Ct
- 5737 W Howard Ct
- 1500 S Cottonwood Ct
- 5804 W Howard Ct
- 5812 W Howard Ct
- 5744 W Howard Ct
- 5833 W Howard Ct
- 5727 W Howard Ct
- 1512 S Cottonwood Ct
- 5822 W Howard Ct
- 1507 S Cottonwood Ct
- 1509 S Peppertree Ct
- 5734 W Howard Ct
- 5830 W Howard Ct
- 1505 S Peppertree Ct
- 5841 W Howard Ct
- 1520 S Cottonwood Ct
Your Personal Tour Guide
Ask me questions while you tour the home.