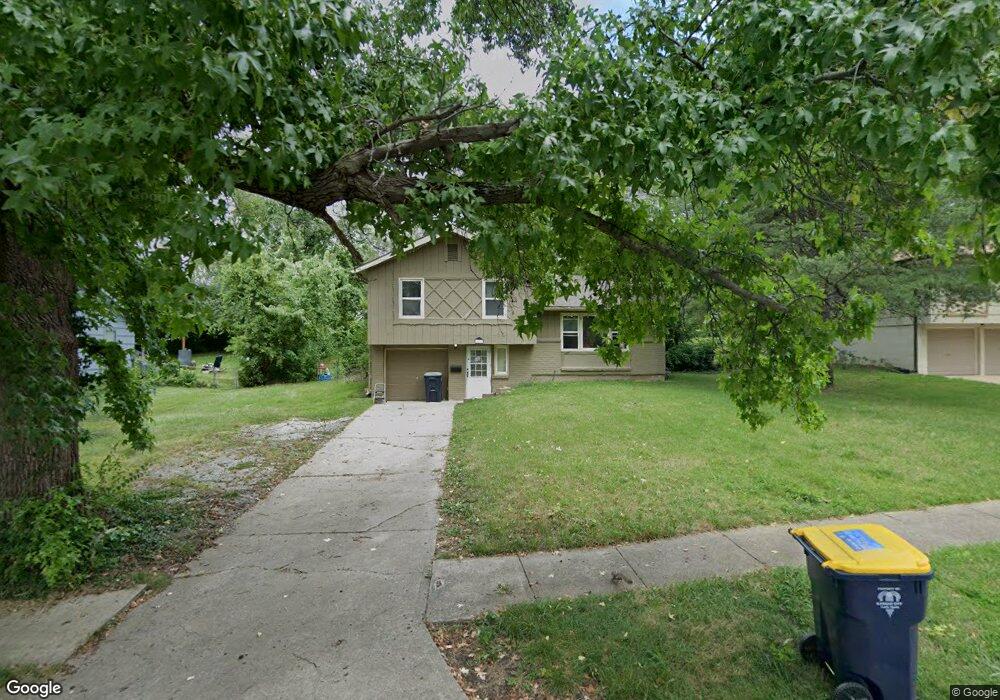
5808 E 97th St Kansas City, MO 64134
Fairlane NeighborhoodEstimated Value: $154,839 - $193,000
3
Beds
1
Bath
904
Sq Ft
$193/Sq Ft
Est. Value
About This Home
This home is located at 5808 E 97th St, Kansas City, MO 64134 and is currently estimated at $174,460, approximately $192 per square foot. 5808 E 97th St is a home located in Jackson County with nearby schools including Dobbs Elementary School, St Regis School, and Islamic School of Greater Kansas City.
Ownership History
Date
Name
Owned For
Owner Type
Purchase Details
Closed on
Feb 11, 2016
Sold by
Cityview Real Estate Services Llc
Bought by
Brown Alan P and Brown Tracy S
Current Estimated Value
Home Financials for this Owner
Home Financials are based on the most recent Mortgage that was taken out on this home.
Original Mortgage
$51,255
Outstanding Balance
$40,886
Interest Rate
3.97%
Mortgage Type
New Conventional
Estimated Equity
$133,574
Purchase Details
Closed on
Sep 26, 2012
Sold by
Waldo Holdings Llc
Bought by
City View Real Estate Services Llc
Purchase Details
Closed on
May 8, 2009
Sold by
Federal Home Loan Mortgage Corporation
Bought by
Waldo Holdings Llc
Purchase Details
Closed on
Jan 16, 2009
Sold by
Brown Norma Lee
Bought by
Federal Home Loan Mortgage Corp
Purchase Details
Closed on
Jun 7, 2007
Sold by
Brown Norma Lee and Kennedy Liz Jean
Bought by
Brown Norma Lee
Create a Home Valuation Report for This Property
The Home Valuation Report is an in-depth analysis detailing your home's value as well as a comparison with similar homes in the area
Home Values in the Area
Average Home Value in this Area
Purchase History
| Date | Buyer | Sale Price | Title Company |
|---|---|---|---|
| Brown Alan P | -- | Continental Title | |
| City View Real Estate Services Llc | -- | Hight & Associates Land Titl | |
| Waldo Holdings Llc | -- | Continental Title Company | |
| Federal Home Loan Mortgage Corp | $45,000 | None Available | |
| Brown Norma Lee | -- | Title Enterprises |
Source: Public Records
Mortgage History
| Date | Status | Borrower | Loan Amount |
|---|---|---|---|
| Open | Brown Alan P | $51,255 |
Source: Public Records
Tax History
| Year | Tax Paid | Tax Assessment Tax Assessment Total Assessment is a certain percentage of the fair market value that is determined by local assessors to be the total taxable value of land and additions on the property. | Land | Improvement |
|---|---|---|---|---|
| 2025 | $2,385 | $20,352 | $2,500 | $17,852 |
| 2024 | $2,342 | $27,556 | $3,050 | $24,506 |
| 2023 | $2,342 | $27,556 | $3,435 | $24,121 |
| 2022 | $1,524 | $15,390 | $2,546 | $12,844 |
| 2021 | $1,315 | $15,390 | $2,546 | $12,844 |
| 2020 | $1,317 | $14,578 | $2,546 | $12,032 |
| 2019 | $1,246 | $14,578 | $2,546 | $12,032 |
| 2018 | $954 | $10,420 | $2,326 | $8,094 |
| 2016 | $913 | $9,690 | $2,683 | $7,007 |
Source: Public Records
Map
Nearby Homes
- 6003 E 99th St
- 6302 Fairlane Dr
- 9700 Hardesty Ave
- 9810 Hardesty Ave
- 5904 E 100th St
- 6212 E 95th Terrace
- 9826 Hardesty Ave
- 5411 E 100th St
- 9806 Bennington Ave
- 10008 Hardesty Ave
- 10109 White Ave
- 6702 E 99th Terrace
- 6810 Fairlane Dr
- 10201 Belmont Ave
- 6302 E 102nd St
- 10230 Oakley Ave
- 7200 E 102nd St
- 9227 Eastern Ave
- 7621 E Bannister Rd
- 9316 Richmond Ave
- 5900 E 97th St
- 5806 E 97th St
- 5809 E 97th St
- 5804 E 97th St
- 5809 E 96th Terrace
- 5902 E 97th St
- 5901 E 97th St
- 5901 E 96th Terrace
- 5807 E 96th Terrace
- 5807 E 97th St
- 5805 E 97th St
- 5903 E 96th Terrace
- 5805 E 96th Terrace
- 5800 E 97th St
- 5905 E 97th St
- 5904 E 97th St
- 5905 E 96th Terrace
- 5801 E 97th St
- 5801 E 96th Terrace
- 5900 E 96th Terrace
Your Personal Tour Guide
Ask me questions while you tour the home.