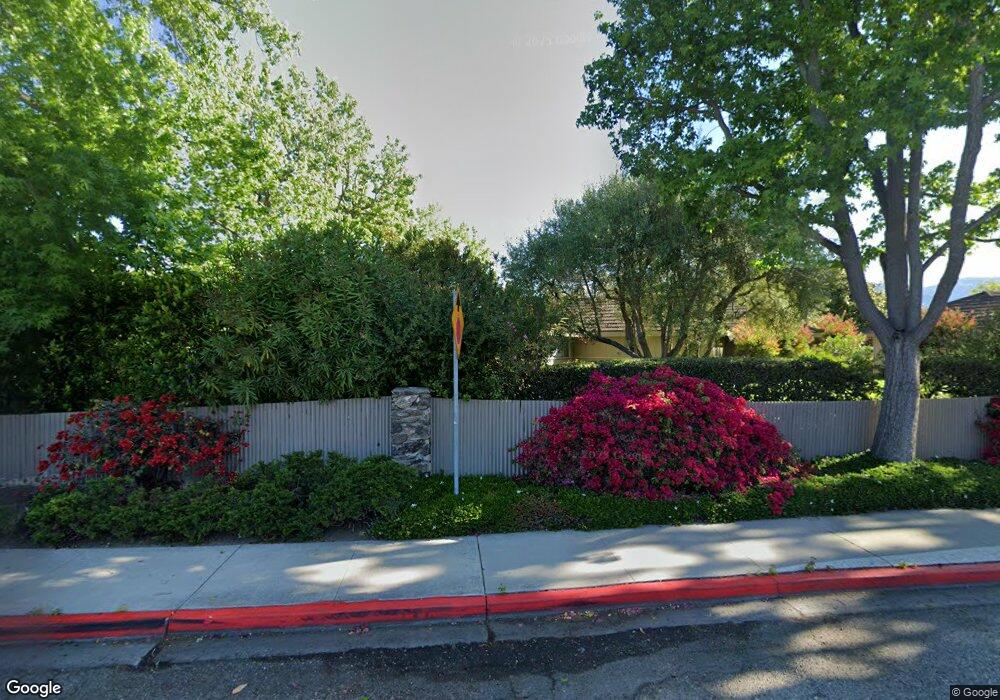
5808 Encina #2 Rd Unit 2 Goleta, CA 93117
Estimated Value: $703,000 - $1,130,000
2
Beds
1
Bath
1,086
Sq Ft
$770/Sq Ft
Est. Value
About This Home
This home is located at 5808 Encina #2 Rd Unit 2, Goleta, CA 93117 and is currently estimated at $835,742, approximately $769 per square foot. 5808 Encina #2 Rd Unit 2 is a home located in Santa Barbara County with nearby schools including Kellogg Elementary School, Goleta Valley Junior High School, and Dos Pueblos Senior High School.
Ownership History
Date
Name
Owned For
Owner Type
Purchase Details
Closed on
Nov 2, 2021
Sold by
Johnsen Eugene C and Johnsen Wanda K
Bought by
Eugene C Johnsen And Wanda K Johnsen Revocabl
Current Estimated Value
Purchase Details
Closed on
Aug 12, 2014
Sold by
Johnsen Eugene C and Johnsen Wanda K
Bought by
Johnsen Eugene C and Johnsen Wanda K
Purchase Details
Closed on
Apr 3, 2013
Sold by
Ettman Omagh S
Bought by
Johnsen Eugene C and Magee Wanda
Purchase Details
Closed on
Dec 11, 2001
Sold by
Endacott Rita M
Bought by
Ettman Omagh S
Home Financials for this Owner
Home Financials are based on the most recent Mortgage that was taken out on this home.
Original Mortgage
$170,000
Interest Rate
5.75%
Mortgage Type
Purchase Money Mortgage
Purchase Details
Closed on
May 9, 1997
Sold by
Endacott Rita M
Bought by
Endacott Rita M
Create a Home Valuation Report for This Property
The Home Valuation Report is an in-depth analysis detailing your home's value as well as a comparison with similar homes in the area
Home Values in the Area
Average Home Value in this Area
Purchase History
| Date | Buyer | Sale Price | Title Company |
|---|---|---|---|
| Eugene C Johnsen And Wanda K Johnsen Revocabl | -- | Malis Julianna M | |
| Johnsen Eugene C | -- | None Available | |
| Johnsen Eugene C | $371,000 | First American Title Company | |
| Ettman Omagh S | $378,000 | First American Title | |
| Endacott Rita M | -- | -- |
Source: Public Records
Mortgage History
| Date | Status | Borrower | Loan Amount |
|---|---|---|---|
| Previous Owner | Ettman Omagh S | $170,000 |
Source: Public Records
Tax History Compared to Growth
Tax History
| Year | Tax Paid | Tax Assessment Tax Assessment Total Assessment is a certain percentage of the fair market value that is determined by local assessors to be the total taxable value of land and additions on the property. | Land | Improvement |
|---|---|---|---|---|
| 2025 | $5,226 | $456,846 | $184,707 | $272,139 |
| 2023 | $5,226 | $439,108 | $177,536 | $261,572 |
| 2022 | $5,065 | $430,499 | $174,055 | $256,444 |
| 2021 | $4,985 | $422,059 | $170,643 | $251,416 |
| 2020 | $4,862 | $417,733 | $168,894 | $248,839 |
| 2019 | $4,779 | $409,543 | $165,583 | $243,960 |
| 2018 | $4,679 | $401,514 | $162,337 | $239,177 |
| 2017 | $4,597 | $393,642 | $159,154 | $234,488 |
| 2016 | $4,466 | $385,925 | $156,034 | $229,891 |
| 2015 | $4,420 | $380,129 | $153,691 | $226,438 |
Source: Public Records
Map
Nearby Homes
- 310 Moreton Bay Ln
- 267 Moreton Bay Ln Unit 2
- 243 Moreton Bay Ln Unit 2
- 313 Moreton Bay Ln Unit 1
- 5745 Berkeley Rd
- 5964 Berkeley Rd
- 5776 Alondra Dr
- 0 N Fairview Ave Unit SR24087795
- 175 N Kellogg Ave
- 5648 Berkeley Rd
- 5710 Stow Canyon Rd
- 5859 Mandarin Dr
- 00 N Fairview Ave
- 122 Kinman Ave
- 151 Kinman Ave
- 5514 Armitos Ave Unit 64
- 41 Dearborn Place Unit 77
- 49 Dearborn Place Unit 14
- 47 Dearborn Place Unit 18
- 345 Kellogg Way Unit 2
- 5808 Encina #1 Rd Unit 1
- 5808 Encina Apt 2 Rd
- 5838 Encina Rd Unit 1
- 5838 Encina Rd Unit 3
- 5838 Encina Rd Unit 2
- 5800 Encina #2 Rd Unit 2
- 5808 Encina Rd Unit 3
- 5808 Encina Rd Unit 2
- 5808 Encina Rd Unit 1
- 5838 Encina #2 Rd Unit 2
- 5838 Encina Road #2
- 5839 Encina Rd
- 5820 Encina Rd Unit 1
- 5820 Encina Rd Unit 3
- 5820 Encina Rd Unit 1
- 5820 Encina Rd Unit 2
- 5820 Encina Rd Unit 3
- 5820 Encina Rd Unit 2
- 5820 Encina Rd Unit 1
- 5800 Encina Rd Unit 3