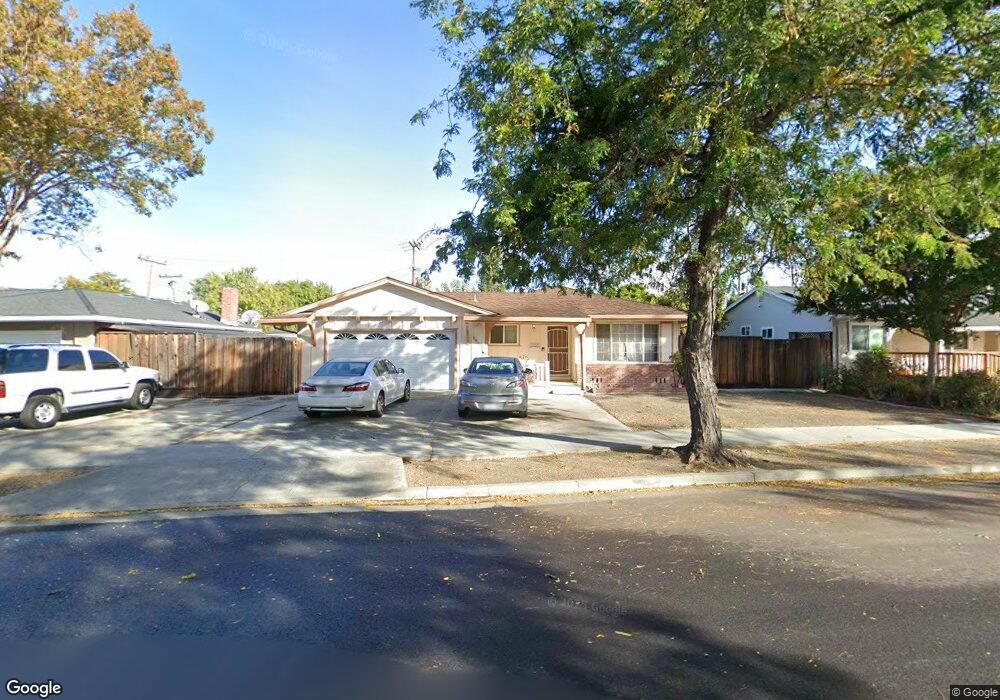
5808 Laguna Seca Way San Jose, CA 95123
Canoas East NeighborhoodEstimated Value: $1,435,000 - $1,628,000
4
Beds
2
Baths
1,516
Sq Ft
$1,010/Sq Ft
Est. Value
About This Home
This home is located at 5808 Laguna Seca Way, San Jose, CA 95123 and is currently estimated at $1,530,837, approximately $1,009 per square foot. 5808 Laguna Seca Way is a home located in Santa Clara County with nearby schools including Frost (Earl) Elementary School, Herman (Leonard) Intermediate School, and Santa Teresa High School.
Ownership History
Date
Name
Owned For
Owner Type
Purchase Details
Closed on
Jun 15, 2016
Sold by
Phan Phillip Martin and Phan Janet Huynh
Bought by
Phan Phillip Martin
Current Estimated Value
Home Financials for this Owner
Home Financials are based on the most recent Mortgage that was taken out on this home.
Original Mortgage
$150,000
Outstanding Balance
$67,122
Interest Rate
3.57%
Mortgage Type
New Conventional
Estimated Equity
$1,463,715
Purchase Details
Closed on
Oct 7, 2014
Sold by
Phan Janet Huynh
Bought by
Phan Phillip Martin and Phan Janet Huynh
Home Financials for this Owner
Home Financials are based on the most recent Mortgage that was taken out on this home.
Original Mortgage
$150,000
Interest Rate
4.08%
Mortgage Type
New Conventional
Purchase Details
Closed on
Jan 28, 1998
Sold by
Furtado Timothy W and Furtado Janice A
Bought by
Phan Alex Hung and Phan Janet Huynh
Home Financials for this Owner
Home Financials are based on the most recent Mortgage that was taken out on this home.
Original Mortgage
$224,000
Interest Rate
6.95%
Create a Home Valuation Report for This Property
The Home Valuation Report is an in-depth analysis detailing your home's value as well as a comparison with similar homes in the area
Home Values in the Area
Average Home Value in this Area
Purchase History
| Date | Buyer | Sale Price | Title Company |
|---|---|---|---|
| Phan Phillip Martin | $75,000 | Fidelity National Title Co | |
| Phan Phillip Martin | $75,000 | North American Title Co Inc | |
| Phan Alex Hung | $280,000 | First American Title Guarant |
Source: Public Records
Mortgage History
| Date | Status | Borrower | Loan Amount |
|---|---|---|---|
| Open | Phan Phillip Martin | $150,000 | |
| Previous Owner | Phan Phillip Martin | $150,000 | |
| Previous Owner | Phan Alex Hung | $224,000 |
Source: Public Records
Tax History Compared to Growth
Tax History
| Year | Tax Paid | Tax Assessment Tax Assessment Total Assessment is a certain percentage of the fair market value that is determined by local assessors to be the total taxable value of land and additions on the property. | Land | Improvement |
|---|---|---|---|---|
| 2025 | $12,227 | $877,187 | $591,896 | $285,291 |
| 2024 | $12,227 | $859,989 | $580,291 | $279,698 |
| 2023 | $12,044 | $843,127 | $568,913 | $274,214 |
| 2022 | $11,972 | $826,596 | $557,758 | $268,838 |
| 2021 | $11,804 | $810,389 | $546,822 | $263,567 |
| 2020 | $11,552 | $802,081 | $541,216 | $260,865 |
| 2019 | $11,287 | $786,354 | $530,604 | $255,750 |
| 2018 | $11,214 | $770,936 | $520,200 | $250,736 |
| 2017 | $11,067 | $755,820 | $510,000 | $245,820 |
| 2016 | $5,926 | $377,660 | $161,855 | $215,805 |
| 2015 | $5,792 | $371,988 | $159,424 | $212,564 |
| 2014 | $5,096 | $364,703 | $156,302 | $208,401 |
Source: Public Records
Map
Nearby Homes
- 5806 Blossom Ave
- 5850 Chesbro Ave
- 5857 Blossom Ave
- 729 Calero Ave
- 521 Canton Dr
- 5749 San Lorenzo Dr
- 5834 Santa Teresa Blvd
- 783 Vereda Ct
- 625 Kiowa Cir
- 638 Lyonburry Place
- 731 Los Huecos Dr
- 737 Los Huecos Dr
- 413 Don Carlos Ct
- 5629 Morton Way
- 469 Velasco Dr
- 405 Don Carlos Ct
- 5504 Don Marcello Ct
- 5660 Calmor Ave Unit 4
- 589 Cadburry Ct
- 482 Calero Ave
- 5812 Laguna Seca Way
- 5806 Laguna Seca Way
- 698 Briarcliff Dr
- 690 Briarcliff Dr
- 5814 Laguna Seca Way
- 684 Briarcliff Dr
- 5825 Laguna Seca Way
- 5811 Laguna Seca Way
- 5807 Laguna Seca Way
- 5818 Laguna Seca Way
- 678 Briarcliff Dr
- 5805 Laguna Seca Way
- 5803 Indian Ave
- 5807 Indian Ave
- 5829 Laguna Seca Way
- 5811 Indian Ave
- 5820 Laguna Seca Way
- 670 Briarcliff Dr
- 5815 Indian Ave
- 5824 Laguna Seca Way