
Seller's Agent in 2025
Bobby Bunch
BUY SELL BUILD QC - Real Broker, LLC
(563) 265-1584
19 in this area
139 Total Sales
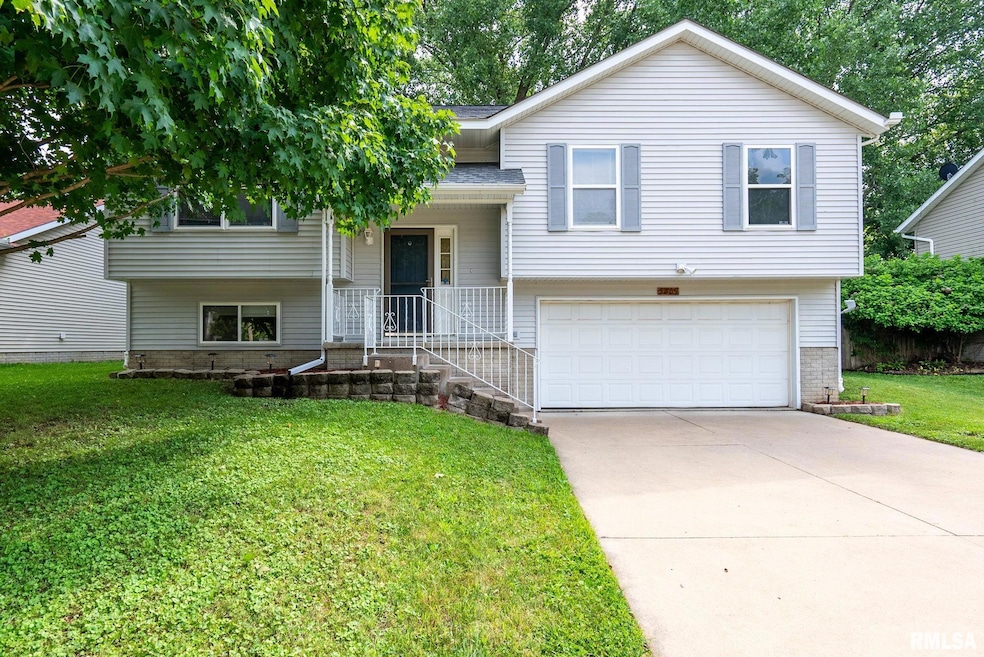


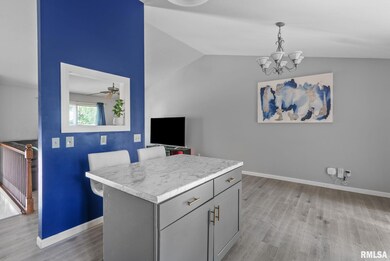

Move-in ready with stylish updates throughout! Step inside this 3-bedroom, 2 full bath split-level home in Davenport and you'll immediately notice the brand-new luxury vinyl plank flooring, plush carpet, and fresh modern finishes. The kitchen has been tastefully updated with sleek new countertops, a trendy backsplash, and stainless steel appliances—all included! The primary bedroom features a private full bath, while the second full bath is conveniently located near the other two bedrooms. There’s plenty of space to relax in both the main living room and the large rec room—perfect for movie nights or entertaining. Enjoy the convenience of the attached 2-car garage, and the finished basement provides even more flexible living space. New roof in 2020. This one checks all the boxes!
Last Agent to Sell the Property
BUY SELL BUILD QC - Real Broker, LLC Brokerage Email: brb@brbsellshomes.com License #S68665000/475.193779 Listed on: 07/09/2025
| Date | Type | Sale Price | Title Company |
|---|---|---|---|
| Warranty Deed | $250,000 | None Listed On Document | |
| Quit Claim Deed | -- | None Listed On Document | |
| Deed | -- | None Listed On Document | |
| Warranty Deed | $160,000 | None Available |
| Date | Status | Loan Amount | Loan Type |
|---|---|---|---|
| Previous Owner | $163,440 | VA |
| Date | Event | Price | List to Sale | Price per Sq Ft |
|---|---|---|---|---|
| 07/28/2025 07/28/25 | Sold | $249,900 | 0.0% | $162 / Sq Ft |
| 07/10/2025 07/10/25 | Pending | -- | -- | -- |
| 07/09/2025 07/09/25 | For Sale | $249,900 | -- | $162 / Sq Ft |
| Year | Tax Paid | Tax Assessment Tax Assessment Total Assessment is a certain percentage of the fair market value that is determined by local assessors to be the total taxable value of land and additions on the property. | Land | Improvement |
|---|---|---|---|---|
| 2025 | $3,512 | $221,340 | $35,280 | $186,060 |
| 2024 | $3,422 | $206,700 | $35,280 | $171,420 |
| 2023 | $3,818 | $206,700 | $35,280 | $171,420 |
| 2022 | $188 | $187,640 | $29,400 | $158,240 |
| 2021 | $188 | $179,310 | $29,400 | $149,910 |
| 2020 | $0 | $168,210 | $29,400 | $138,810 |
| 2019 | $3,654 | $161,270 | $29,400 | $131,870 |
| 2018 | $0 | $161,270 | $29,400 | $131,870 |
| 2017 | $897 | $161,270 | $29,400 | $131,870 |
| 2016 | $3,268 | $161,270 | $0 | $0 |
| 2015 | $3,268 | $153,010 | $0 | $0 |
| 2014 | $3,130 | $153,010 | $0 | $0 |
| 2013 | $3,070 | $0 | $0 | $0 |
| 2012 | -- | $143,750 | $26,800 | $116,950 |
Seller's Agent in 2025
Bobby Bunch
BUY SELL BUILD QC - Real Broker, LLC
(563) 265-1584
19 in this area
139 Total Sales
Buyer's Agent in 2025
Kelly Dietz
BUY SELL BUILD QC - Real Broker, LLC
(563) 639-9400
9 in this area
71 Total Sales
Source: RMLS Alliance
MLS Number: QC4265165
APN: W0905B31
Disclaimer: Certain information contained herein is derived from information provided by parties other than Homes.com. All information provided is deemed reliable, but is not guaranteed to be accurate and should be independently verified.
![]() IDX information is provided exclusively for personal, non-commercial use, and may not be used for any purpose other than to identify prospective properties consumers may be interested in purchasing. Information is deemed reliable but not guaranteed.
IDX information is provided exclusively for personal, non-commercial use, and may not be used for any purpose other than to identify prospective properties consumers may be interested in purchasing. Information is deemed reliable but not guaranteed.