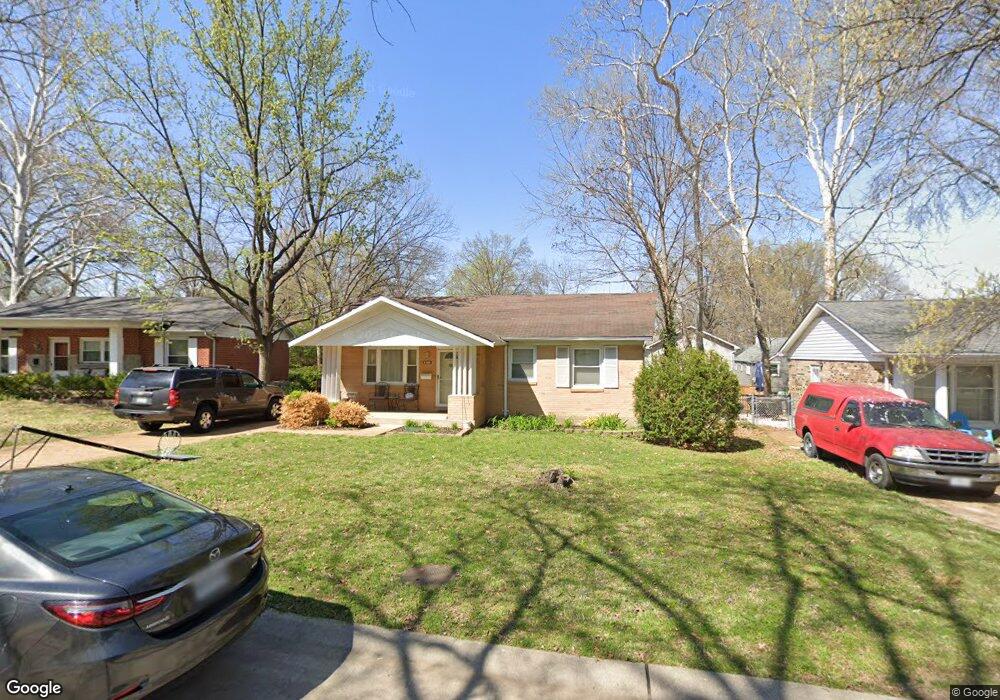
5809 Langley Ave Saint Louis, MO 63123
Estimated Value: $210,000 - $237,000
3
Beds
1
Bath
1,102
Sq Ft
$201/Sq Ft
Est. Value
About This Home
This home is located at 5809 Langley Ave, Saint Louis, MO 63123 and is currently estimated at $221,844, approximately $201 per square foot. 5809 Langley Ave is a home located in St. Louis County with nearby schools including Mesnier Primary School, Gotsch Intermediate School, and Rogers Middle School.
Ownership History
Date
Name
Owned For
Owner Type
Purchase Details
Closed on
Aug 1, 2017
Sold by
Moore Candace
Bought by
Schweiger Daniel
Current Estimated Value
Purchase Details
Closed on
Jun 16, 2003
Sold by
Roy Roland A and Roy Kathleen M
Bought by
Schweiger Daniel and Schweiger Candace
Home Financials for this Owner
Home Financials are based on the most recent Mortgage that was taken out on this home.
Original Mortgage
$124,835
Interest Rate
5.88%
Mortgage Type
FHA
Create a Home Valuation Report for This Property
The Home Valuation Report is an in-depth analysis detailing your home's value as well as a comparison with similar homes in the area
Home Values in the Area
Average Home Value in this Area
Purchase History
| Date | Buyer | Sale Price | Title Company |
|---|---|---|---|
| Schweiger Daniel | -- | None Available | |
| Schweiger Daniel | $126,600 | -- |
Source: Public Records
Mortgage History
| Date | Status | Borrower | Loan Amount |
|---|---|---|---|
| Previous Owner | Schweiger Daniel | $124,835 |
Source: Public Records
Tax History
| Year | Tax Paid | Tax Assessment Tax Assessment Total Assessment is a certain percentage of the fair market value that is determined by local assessors to be the total taxable value of land and additions on the property. | Land | Improvement |
|---|---|---|---|---|
| 2025 | $2,727 | $39,370 | $14,540 | $24,830 |
| 2024 | $2,727 | $33,780 | $9,690 | $24,090 |
| 2023 | $2,637 | $33,780 | $9,690 | $24,090 |
| 2022 | $2,524 | $29,450 | $9,690 | $19,760 |
| 2021 | $2,466 | $29,450 | $9,690 | $19,760 |
| 2020 | $2,370 | $26,400 | $9,600 | $16,800 |
| 2019 | $2,365 | $26,400 | $9,600 | $16,800 |
| 2018 | $2,173 | $21,420 | $6,710 | $14,710 |
| 2017 | $2,159 | $21,420 | $6,710 | $14,710 |
| 2016 | $1,912 | $20,140 | $5,760 | $14,380 |
Source: Public Records
Map
Nearby Homes
- 8506 Mathilda Ave
- 5315 Vine Ave
- 9225 Pavia Ave
- 8628 Charlton Ln
- 9018 Vasel Dr
- 8019 Genesta St
- 5138 Lode Ave
- 6209 Bixby Ave
- 8016 Wynwood Dr
- 8520 Ava Dr
- 6321 Sheppard Dr
- 9320 Sterling Place
- 7809 Genesta St
- 8501 Palmetto Dr
- 4909 Arbors at Stonegate Ct
- 9319 Lenard Ct
- 8200 New Hampshire Ave
- 6421 Judson Ave
- 8206 Gravois Rd
- 6714 Colony Acres Dr
- 5801 Langley Ave
- 5817 Langley Ave
- 5708 Welmering Dr
- 5706 Welmering Dr
- 5714 Welmering Dr
- 5704 Welmering Dr
- 5727 Langley Ave
- 5810 Langley Ave
- 5720 Welmering Dr
- 5823 Langley Ave
- 5702 Welmering Dr
- 5700 Welmering Dr
- 8501 Talma Ct
- 561012 Welmering Ave
- 5721 Langley Ave
- 8504 Talma Ct
- 5726 Welmering Dr
- 8503 Talma Ct
- 8505 Elgin Ave
- 5640 Welmering Dr
Your Personal Tour Guide
Ask me questions while you tour the home.