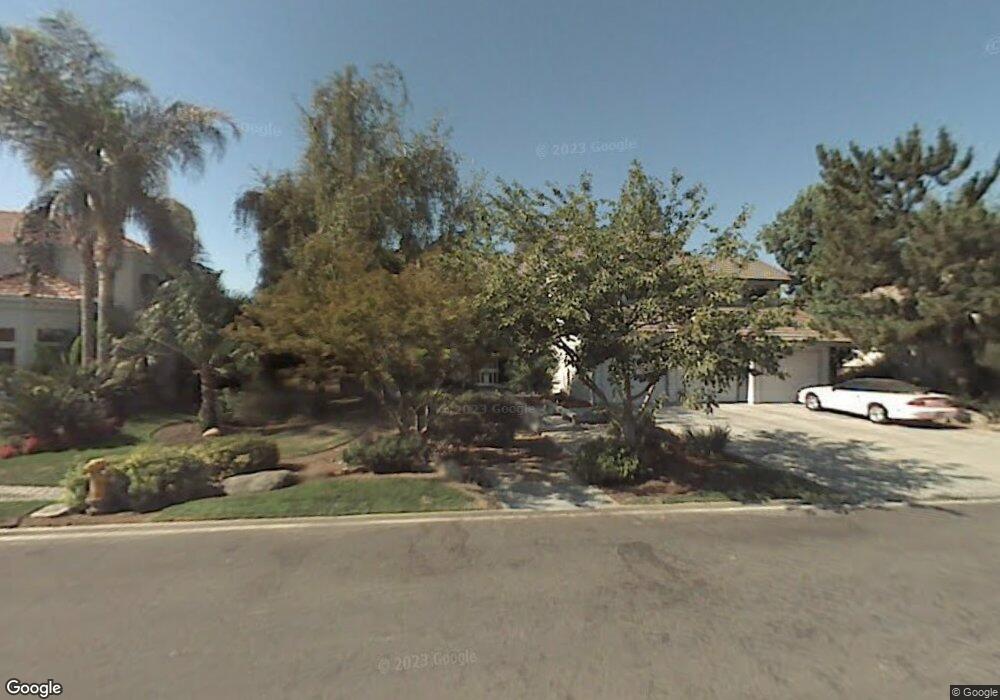
5809 W Prospect Dr Visalia, CA 93291
Northwest Visalia NeighborhoodEstimated Value: $742,000 - $951,000
4
Beds
4
Baths
3,413
Sq Ft
$244/Sq Ft
Est. Value
About This Home
This home is located at 5809 W Prospect Dr, Visalia, CA 93291 and is currently estimated at $831,385, approximately $243 per square foot. 5809 W Prospect Dr is a home located in Tulare County with nearby schools including Hurley Elementary School, Ridgeview Middle, and Redwood High School.
Ownership History
Date
Name
Owned For
Owner Type
Purchase Details
Closed on
Nov 19, 2021
Sold by
Hunt Bruce A and Searcy Hunt Marshella
Bought by
Hunt Bruce A and Searcy Hunt Marshella
Current Estimated Value
Purchase Details
Closed on
Jun 12, 2020
Sold by
Hunt Bruce A
Bought by
Searcy Hunt Marshella Dawn and Hunt Bruce A
Home Financials for this Owner
Home Financials are based on the most recent Mortgage that was taken out on this home.
Original Mortgage
$278,000
Interest Rate
2.9%
Mortgage Type
New Conventional
Purchase Details
Closed on
Jan 23, 2002
Sold by
Stockman Neil L
Bought by
Hunt Bruce A
Home Financials for this Owner
Home Financials are based on the most recent Mortgage that was taken out on this home.
Original Mortgage
$300,000
Interest Rate
6.99%
Purchase Details
Closed on
Nov 7, 2000
Sold by
Mathis William R
Bought by
Stockman Neil L and Stockman Judith A
Home Financials for this Owner
Home Financials are based on the most recent Mortgage that was taken out on this home.
Original Mortgage
$287,920
Interest Rate
7.86%
Create a Home Valuation Report for This Property
The Home Valuation Report is an in-depth analysis detailing your home's value as well as a comparison with similar homes in the area
Home Values in the Area
Average Home Value in this Area
Purchase History
| Date | Buyer | Sale Price | Title Company |
|---|---|---|---|
| Hunt Bruce A | -- | None Available | |
| Searcy Hunt Marshella Dawn | -- | Wfg Lender Services | |
| Hunt Bruce A | $392,500 | Chicago Title Co | |
| Stockman Neil L | $360,000 | First American Title Co |
Source: Public Records
Mortgage History
| Date | Status | Borrower | Loan Amount |
|---|---|---|---|
| Previous Owner | Searcy Hunt Marshella Dawn | $278,000 | |
| Previous Owner | Hunt Bruce A | $300,000 | |
| Previous Owner | Stockman Neil L | $287,920 |
Source: Public Records
Tax History
| Year | Tax Paid | Tax Assessment Tax Assessment Total Assessment is a certain percentage of the fair market value that is determined by local assessors to be the total taxable value of land and additions on the property. | Land | Improvement |
|---|---|---|---|---|
| 2025 | $6,021 | $579,855 | $184,667 | $395,188 |
| 2024 | $6,021 | $568,487 | $181,047 | $387,440 |
| 2023 | $5,854 | $557,342 | $177,498 | $379,844 |
| 2022 | $5,592 | $546,415 | $174,018 | $372,397 |
| 2021 | $5,598 | $535,701 | $170,606 | $365,095 |
| 2020 | $5,571 | $530,208 | $168,857 | $361,351 |
| 2019 | $5,388 | $519,812 | $165,546 | $354,266 |
| 2018 | $5,272 | $509,620 | $162,300 | $347,320 |
| 2017 | $5,194 | $499,628 | $159,118 | $340,510 |
| 2016 | $5,118 | $489,831 | $155,998 | $333,833 |
| 2015 | $4,969 | $482,474 | $153,655 | $328,819 |
| 2014 | $4,969 | $473,023 | $150,645 | $322,378 |
Source: Public Records
Map
Nearby Homes
- 5721 W Prospect Dr
- 1700 N Roeben Dr
- 5512 W Prospect Ave
- 5525 W Perez Ave
- 6259 W Prospect Ave
- 1536 N Tamarack St
- 5812 W Ceres Ave
- 6337 W Elowin Ave
- 1611 N Pienza St
- 5733 W Babcock Ave
- 6229 W Ceres Ave
- 1608 N Oliveto Ct
- 4039 W Babcock Ave
- 3949 W Sunnyview Ave Unit 2019 V
- 4015 W Sunnyview Ave
- 4034 W Babcock Ave
- 4035 W Sunnyview Ave
- 4021 W Sunnyview Ave Unit 2015v
- 4043 W Babcock Ave Unit 1036 V
- 4034 W Babcock Ave Unit 1057 V
- 5747 W Prospect Ave
- 5821 W Prospect Dr
- 5747 W Prospect Dr
- 5746 W Prospect Ave
- 5733 W Prospect Ave
- 5746 W Prospect Dr
- 5733 W Prospect Dr
- 5732 W Prospect Dr
- 5911 W Prospect Ave
- 5833 W Prospect Dr
- 5721 W Prospect Dr
- 5749 W Buena Vista Ave
- 5737 W Buena Vista Ave
- 5824 W Elowin Dr
- 5807 W Buena Vista Ave
- 5804 W Elowin Dr
- 5720 W Prospect Dr
- 5727 W Buena Vista Ave
- 5744 W Elowin Dr
- 5819 W Buena Vista Ave
Your Personal Tour Guide
Ask me questions while you tour the home.