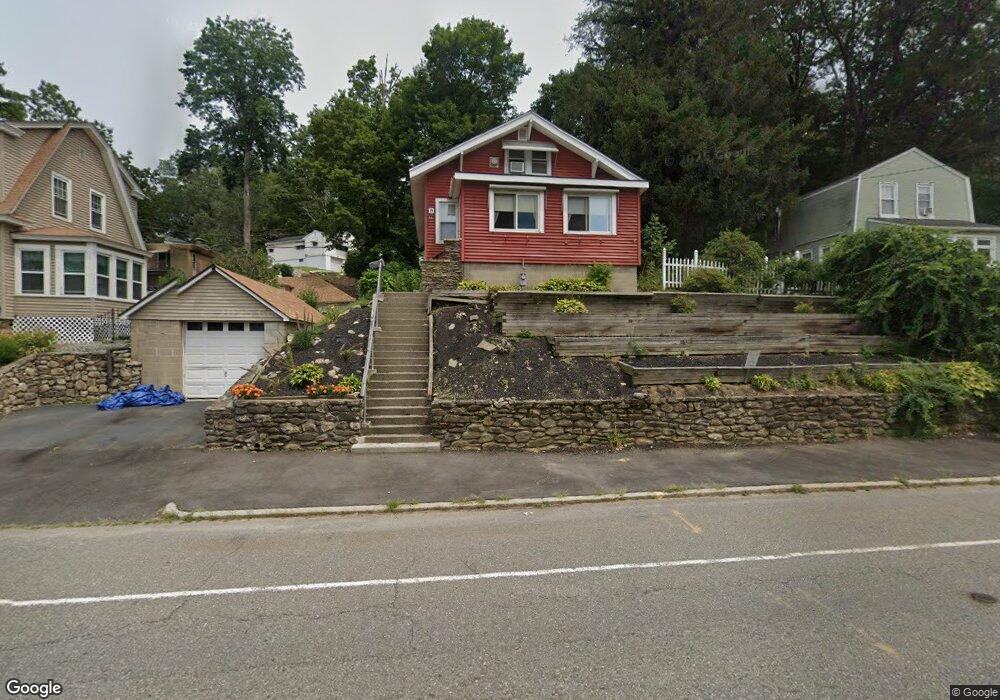
581 Chandler St Worcester, MA 01602
Tatnuck NeighborhoodEstimated Value: $366,000 - $417,000
3
Beds
1
Bath
1,198
Sq Ft
$324/Sq Ft
Est. Value
About This Home
This home is located at 581 Chandler St, Worcester, MA 01602 and is currently estimated at $388,188, approximately $324 per square foot. 581 Chandler St is a home located in Worcester County with nearby schools including Chandler Magnet, Tatnuck Magnet School, and Jacob Hiatt Magnet School.
Ownership History
Date
Name
Owned For
Owner Type
Purchase Details
Closed on
Sep 29, 2014
Sold by
Mohamed Tami L
Bought by
Buchyn Charlene A
Current Estimated Value
Home Financials for this Owner
Home Financials are based on the most recent Mortgage that was taken out on this home.
Original Mortgage
$77,500
Outstanding Balance
$59,459
Interest Rate
4.12%
Mortgage Type
New Conventional
Estimated Equity
$328,729
Purchase Details
Closed on
Feb 4, 2005
Sold by
Buchyn Shirley M and Buchyn William E
Bought by
Buchyn Charlene Anne and Mohamed Tami Lee
Create a Home Valuation Report for This Property
The Home Valuation Report is an in-depth analysis detailing your home's value as well as a comparison with similar homes in the area
Home Values in the Area
Average Home Value in this Area
Purchase History
| Date | Buyer | Sale Price | Title Company |
|---|---|---|---|
| Buchyn Charlene A | -- | -- | |
| Buchyn Charlene Anne | -- | -- |
Source: Public Records
Mortgage History
| Date | Status | Borrower | Loan Amount |
|---|---|---|---|
| Open | Buchyn Charlene A | $77,500 |
Source: Public Records
Tax History
| Year | Tax Paid | Tax Assessment Tax Assessment Total Assessment is a certain percentage of the fair market value that is determined by local assessors to be the total taxable value of land and additions on the property. | Land | Improvement |
|---|---|---|---|---|
| 2025 | $4,103 | $311,100 | $112,700 | $198,400 |
| 2024 | $4,030 | $293,100 | $112,700 | $180,400 |
| 2023 | $3,856 | $268,900 | $98,000 | $170,900 |
| 2022 | $3,501 | $230,200 | $78,400 | $151,800 |
| 2021 | $3,279 | $201,400 | $62,700 | $138,700 |
| 2020 | $3,478 | $204,600 | $62,700 | $141,900 |
| 2019 | $3,280 | $182,200 | $56,400 | $125,800 |
| 2018 | $3,271 | $173,000 | $56,400 | $116,600 |
| 2017 | $3,160 | $164,400 | $56,400 | $108,000 |
| 2016 | $3,118 | $151,300 | $41,800 | $109,500 |
| 2015 | $3,037 | $151,300 | $41,800 | $109,500 |
| 2014 | $2,956 | $151,300 | $41,800 | $109,500 |
Source: Public Records
Map
Nearby Homes
- 47R Yarnie Unit 3A
- 47R Yarnie Unit 1B
- 47R Yarnie Unit 2B
- 47R Yarnie Unit 4B
- 47R Yarnie Unit 8B
- 47R Yarnie Unit 5A
- 47R Yarnie Unit 6B
- 47R Yarnie Unit 4A
- 47R Yarnie Unit 1A
- 47R Yarnie Unit 9
- 47R Yarnie Unit 8A
- 47R Yarnie Unit 6A
- 47R Yarnie Unit 7A
- 47R Yarnie Unit 5B
- 47R Yarnie Unit 2A
- 47R Yarnie Unit 7B
- 12 Cardinal Rd
- 23 Tiverton Pkwy
- 32 Zenith Dr
- 8 Modred Ct
Your Personal Tour Guide
Ask me questions while you tour the home.