Estimated Value: $592,100 - $633,000
4
Beds
3
Baths
1,790
Sq Ft
$342/Sq Ft
Est. Value
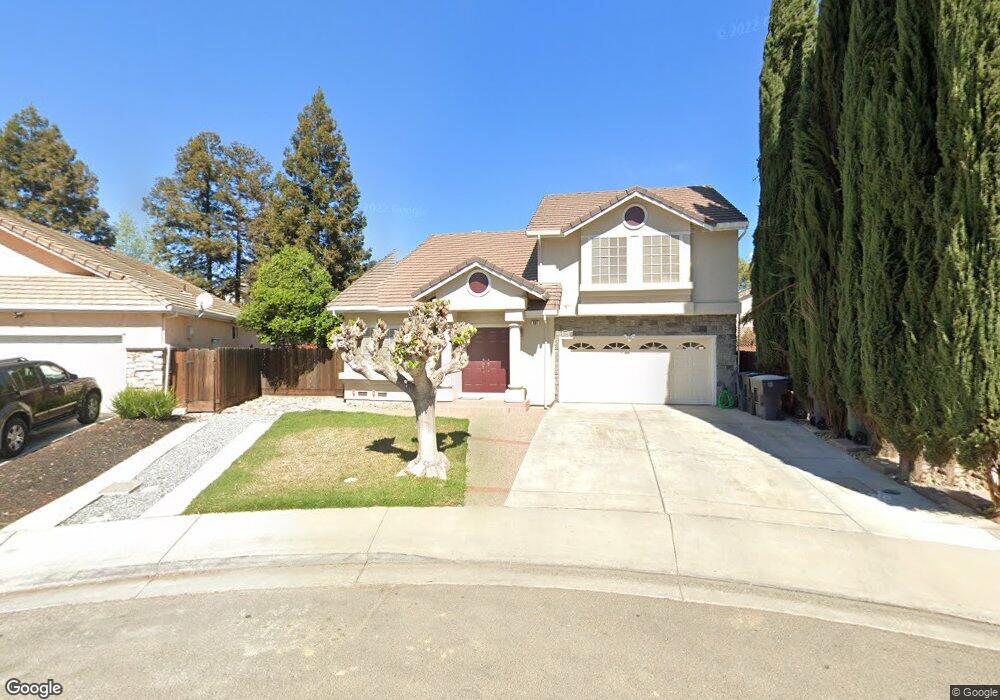
About This Home
This home is located at 581 Czerny St, Tracy, CA 95376 and is currently estimated at $612,025, approximately $341 per square foot. 581 Czerny St is a home located in San Joaquin County with nearby schools including Louis A. Bohn Elementary School, Earle E. Williams Middle School, and Tracy High School.
Ownership History
Date
Name
Owned For
Owner Type
Purchase Details
Closed on
Nov 19, 2025
Sold by
Bogetti Brandon
Bought by
Brandon And Jennifer Bogetti Living Trust and Bogetti
Current Estimated Value
Purchase Details
Closed on
Jul 26, 2001
Sold by
The Spencer David Company Inc and Yazdani Behrooz
Bought by
Bogetti Brandon
Home Financials for this Owner
Home Financials are based on the most recent Mortgage that was taken out on this home.
Original Mortgage
$218,000
Interest Rate
7.15%
Mortgage Type
Balloon
Purchase Details
Closed on
Aug 2, 2000
Sold by
Hill Shirley D
Bought by
The Spencer David Company Inc and Yazdani Behrooz
Purchase Details
Closed on
Aug 31, 1999
Sold by
Hill Tom
Bought by
Hill Shirley D
Home Financials for this Owner
Home Financials are based on the most recent Mortgage that was taken out on this home.
Original Mortgage
$133,900
Interest Rate
9.25%
Create a Home Valuation Report for This Property
The Home Valuation Report is an in-depth analysis detailing your home's value as well as a comparison with similar homes in the area
Home Values in the Area
Average Home Value in this Area
Purchase History
| Date | Buyer | Sale Price | Title Company |
|---|---|---|---|
| Brandon And Jennifer Bogetti Living Trust | -- | None Listed On Document | |
| Bogetti Brandon | $275,000 | Fidelity National Title Co | |
| The Spencer David Company Inc | $25,000 | -- | |
| Hill Shirley D | -- | Old Republic Title Company | |
| Hill Shirley D | $216,000 | Old Republic Title Company |
Source: Public Records
Mortgage History
| Date | Status | Borrower | Loan Amount |
|---|---|---|---|
| Previous Owner | Bogetti Brandon | $218,000 | |
| Previous Owner | Hill Shirley D | $133,900 |
Source: Public Records
Tax History
| Year | Tax Paid | Tax Assessment Tax Assessment Total Assessment is a certain percentage of the fair market value that is determined by local assessors to be the total taxable value of land and additions on the property. | Land | Improvement |
|---|---|---|---|---|
| 2025 | $4,904 | $406,233 | $121,130 | $285,103 |
| 2024 | $4,529 | $398,268 | $118,755 | $279,513 |
| 2023 | $4,456 | $390,460 | $116,427 | $274,033 |
| 2022 | $4,364 | $382,805 | $114,145 | $268,660 |
| 2021 | $4,310 | $375,300 | $111,907 | $263,393 |
| 2020 | $4,280 | $371,453 | $110,760 | $260,693 |
| 2019 | $4,210 | $364,171 | $108,589 | $255,582 |
| 2018 | $4,379 | $357,031 | $106,460 | $250,571 |
| 2017 | $4,176 | $350,031 | $104,373 | $245,658 |
| 2016 | $4,213 | $343,170 | $102,327 | $240,843 |
| 2014 | $3,729 | $309,000 | $92,000 | $217,000 |
Source: Public Records
Map
Nearby Homes
- 480 Gonzalez St
- 592 Charlemagne Ln
- 320 Accipiter Ct
- 243 E 3rd St
- 18 W 8th St
- 110 Loma Prieta Cir
- 515 Peerless Way Unit 13
- 213 W South St
- 1465 Franklin Ave
- 389 Burlington Dr
- 1110 Amaretto Dr
- 206 W 12th St
- 448 Burlington Dr
- 1495 Mae Ave
- 1243 Parker Ave Unit 2
- 1245 Parker Ave Unit 3
- 1241 Parker Ave Unit 1
- 145 Machado Ct
- 920 Taft Ave
- 143 W Beverly Place
Your Personal Tour Guide
Ask me questions while you tour the home.