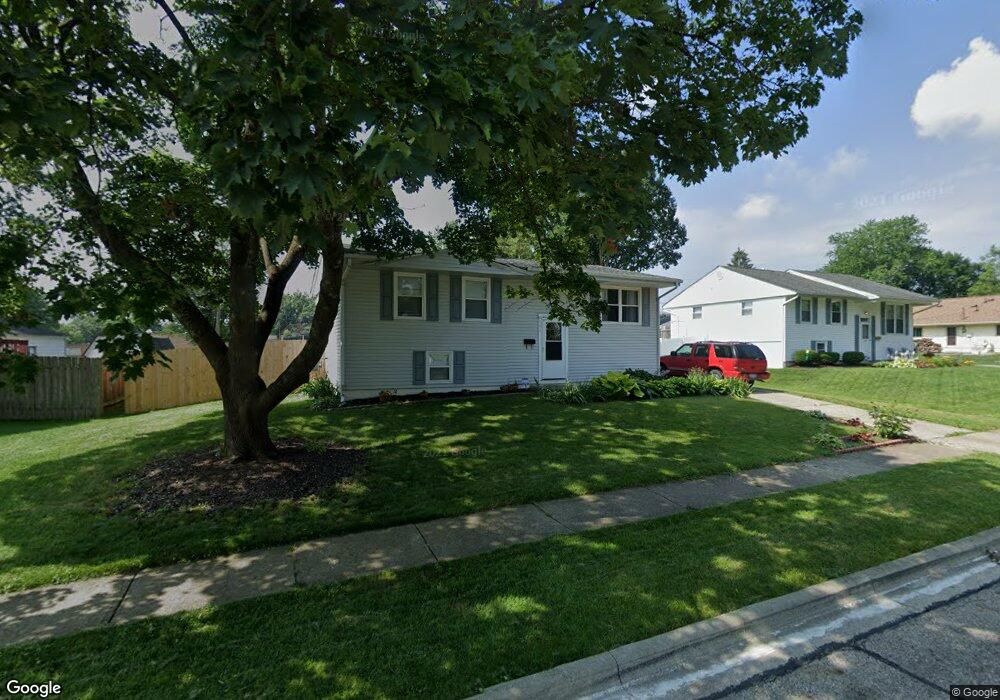
581 Empire Dr N Columbus, OH 43230
Estimated Value: $264,000 - $300,000
4
Beds
3
Baths
1,655
Sq Ft
$172/Sq Ft
Est. Value
About This Home
This home is located at 581 Empire Dr N, Columbus, OH 43230 and is currently estimated at $284,775, approximately $172 per square foot. 581 Empire Dr N is a home located in Franklin County with nearby schools including Royal Manor Elementary School, Gahanna West Middle School, and Lincoln High School.
Ownership History
Date
Name
Owned For
Owner Type
Purchase Details
Closed on
Dec 30, 2011
Sold by
Soskin Alexander
Bought by
Lovins Joshua A
Current Estimated Value
Home Financials for this Owner
Home Financials are based on the most recent Mortgage that was taken out on this home.
Original Mortgage
$96,490
Outstanding Balance
$66,999
Interest Rate
4.25%
Mortgage Type
FHA
Estimated Equity
$217,776
Purchase Details
Closed on
Jun 20, 2011
Sold by
Kim Crgig Jerry and Kim Craig
Bought by
Soskin Alexander
Purchase Details
Closed on
Aug 29, 1997
Sold by
Biddle George D and Biddle Ruth E
Bought by
Kim Craig Jerry and Kim Craig
Home Financials for this Owner
Home Financials are based on the most recent Mortgage that was taken out on this home.
Original Mortgage
$67,200
Interest Rate
7.44%
Purchase Details
Closed on
Mar 1, 1996
Sold by
Biddle George D and Biddle Ruth E
Bought by
Craig Jerry and Craig Kim L
Home Financials for this Owner
Home Financials are based on the most recent Mortgage that was taken out on this home.
Original Mortgage
$63,000
Interest Rate
7.56%
Mortgage Type
Seller Take Back
Create a Home Valuation Report for This Property
The Home Valuation Report is an in-depth analysis detailing your home's value as well as a comparison with similar homes in the area
Home Values in the Area
Average Home Value in this Area
Purchase History
| Date | Buyer | Sale Price | Title Company |
|---|---|---|---|
| Lovins Joshua A | $99,000 | Valmer Land | |
| Soskin Alexander | $58,100 | Attorney | |
| Kim Craig Jerry | $70,000 | Chelsea Title Agency | |
| Craig Jerry | $70,000 | -- |
Source: Public Records
Mortgage History
| Date | Status | Borrower | Loan Amount |
|---|---|---|---|
| Open | Lovins Joshua A | $96,490 | |
| Previous Owner | Kim Craig Jerry | $67,200 | |
| Previous Owner | Craig Jerry | $63,000 |
Source: Public Records
Tax History Compared to Growth
Tax History
| Year | Tax Paid | Tax Assessment Tax Assessment Total Assessment is a certain percentage of the fair market value that is determined by local assessors to be the total taxable value of land and additions on the property. | Land | Improvement |
|---|---|---|---|---|
| 2024 | $4,603 | $74,480 | $24,710 | $49,770 |
| 2023 | $4,548 | $74,480 | $24,710 | $49,770 |
| 2022 | $3,924 | $52,540 | $14,810 | $37,730 |
| 2021 | $3,795 | $52,540 | $14,810 | $37,730 |
| 2020 | $3,763 | $52,540 | $14,810 | $37,730 |
| 2019 | $3,171 | $44,180 | $12,360 | $31,820 |
| 2018 | $2,911 | $43,720 | $12,360 | $31,360 |
| 2017 | $2,792 | $43,720 | $12,360 | $31,360 |
| 2016 | $2,704 | $37,380 | $11,620 | $25,760 |
| 2015 | $2,706 | $37,380 | $11,620 | $25,760 |
| 2014 | $2,668 | $37,140 | $11,620 | $25,520 |
| 2013 | $1,325 | $37,135 | $11,620 | $25,515 |
Source: Public Records
Map
Nearby Homes
- 343 Imperial Dr
- 278 Empire Dr
- 463 Lincolnshire Rd
- 470 Deerwood Ave E
- 668 Kenilworth Ct
- 221 Lincolnshire Rd
- 404 Foxwood Dr
- 209 Imperial Dr
- 2741 Acarie Dr
- 464 Foxwood Dr
- 4131 Claver Dr
- 4093 Adalric Dr
- 2851 Acarie Dr
- 3610 N Stygler Rd
- 2694 Kantian Dr
- 600 Agler Rd
- 536 Springwood Lake Dr
- 3888 Agler Rd
- 3877 Hines Rd
- 0 Stelzer Rd Unit L 225022351
- 575 Empire Dr N
- 589 Empire Dr N
- 565 Empire Dr N
- 360 Triumph Way
- 350 Triumph Way
- 580 Empire Dr N
- 588 Empire Dr N
- 559 Empire Dr N
- 594 Empire Dr N
- 344 Triumph Way
- 378 Elkwood Place
- 600 Empire Dr N
- 553 Empire Dr N
- 387 Elkwood Place
- 606 Empire Dr N
- 589 Deerwood Ave
- 363 Triumph Way
- 560 Empire Dr N
- 355 Triumph Way
- 336 Triumph Way