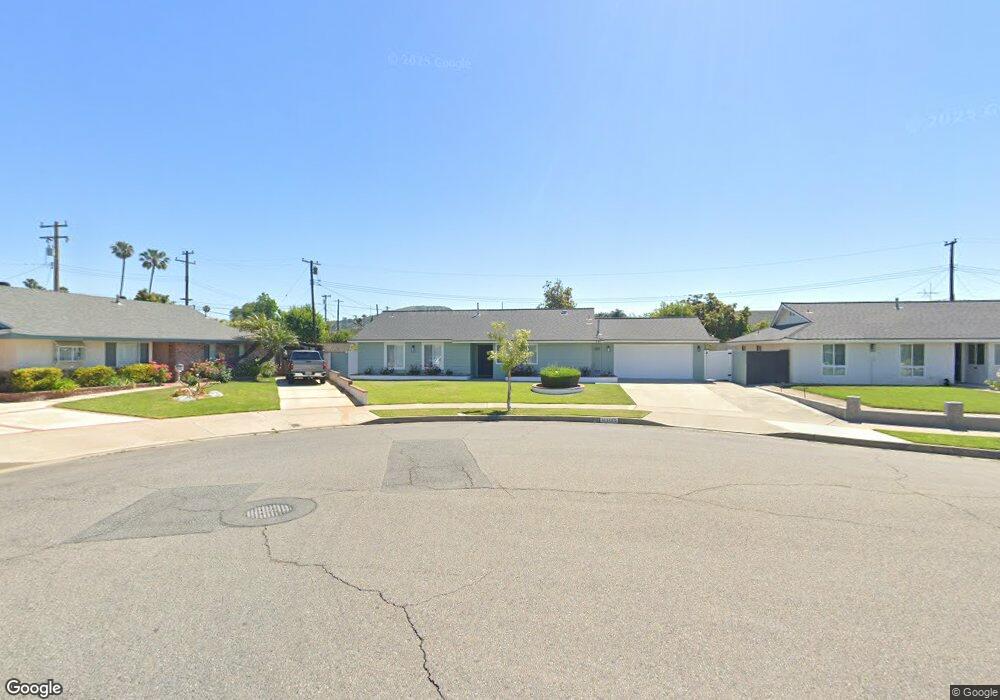
581 N La Nae Cir Orange, CA 92869
Estimated Value: $979,496 - $1,110,000
4
Beds
2
Baths
1,575
Sq Ft
$675/Sq Ft
Est. Value
About This Home
This home is located at 581 N La Nae Cir, Orange, CA 92869 and is currently estimated at $1,062,874, approximately $674 per square foot. 581 N La Nae Cir is a home located in Orange County with nearby schools including Prospect Elementary School, El Modena High School, and Orange County Classical Academy.
Ownership History
Date
Name
Owned For
Owner Type
Purchase Details
Closed on
Aug 28, 2021
Sold by
Ruiz Erminia F
Bought by
Erminia F Ruiz Family Trust
Current Estimated Value
Purchase Details
Closed on
Mar 14, 2007
Sold by
Rodriguez Erminia and Ruiz Erminia F
Bought by
Ruiz Erminia F
Purchase Details
Closed on
Oct 6, 2004
Sold by
Rodriguez Ruben A
Bought by
Rodriguez Erminia
Home Financials for this Owner
Home Financials are based on the most recent Mortgage that was taken out on this home.
Original Mortgage
$94,000
Interest Rate
5.72%
Mortgage Type
Credit Line Revolving
Purchase Details
Closed on
Mar 9, 1994
Sold by
Rodriguez Ruben A and Rodriguez Dora L
Bought by
Rodriguez Ruben A and Rodriguez Ermenia F
Home Financials for this Owner
Home Financials are based on the most recent Mortgage that was taken out on this home.
Original Mortgage
$161,500
Interest Rate
7.38%
Create a Home Valuation Report for This Property
The Home Valuation Report is an in-depth analysis detailing your home's value as well as a comparison with similar homes in the area
Home Values in the Area
Average Home Value in this Area
Purchase History
| Date | Buyer | Sale Price | Title Company |
|---|---|---|---|
| Erminia F Ruiz Family Trust | -- | None Listed On Document | |
| Ruiz Erminia F | -- | None Available | |
| Rodriguez Erminia | -- | Ticor Title | |
| Rodriguez Ruben A | $170,000 | Stewart Title |
Source: Public Records
Mortgage History
| Date | Status | Borrower | Loan Amount |
|---|---|---|---|
| Previous Owner | Rodriguez Erminia | $94,000 | |
| Previous Owner | Rodriguez Ruben A | $161,500 |
Source: Public Records
Tax History Compared to Growth
Tax History
| Year | Tax Paid | Tax Assessment Tax Assessment Total Assessment is a certain percentage of the fair market value that is determined by local assessors to be the total taxable value of land and additions on the property. | Land | Improvement |
|---|---|---|---|---|
| 2025 | $3,387 | $288,933 | $183,184 | $105,749 |
| 2024 | $3,387 | $283,268 | $179,592 | $103,676 |
| 2023 | $3,310 | $277,714 | $176,070 | $101,644 |
| 2022 | $3,244 | $272,269 | $172,618 | $99,651 |
| 2021 | $3,156 | $266,931 | $169,233 | $97,698 |
| 2020 | $3,127 | $264,194 | $167,497 | $96,697 |
| 2019 | $3,090 | $259,014 | $164,213 | $94,801 |
| 2018 | $3,044 | $253,936 | $160,993 | $92,943 |
| 2017 | $2,923 | $248,957 | $157,836 | $91,121 |
| 2016 | $2,868 | $244,076 | $154,741 | $89,335 |
| 2015 | $2,826 | $240,410 | $152,416 | $87,994 |
| 2014 | $2,766 | $235,701 | $149,430 | $86,271 |
Source: Public Records
Map
Nearby Homes
- 659 N Oxford Ct
- 3518 E Berkshire Ct Unit D
- 3527 E Barrington Dr
- 3509 E Berkshire Ct Unit C
- 3421 E Salisbury Cir Unit A
- 3932 E Sycamore Ave
- 3318 E Chardonnay Ln Unit B
- 3801 E Spring St
- 448 N Londonderry Ln Unit D
- 692 N Adele St Unit 30
- 692 N Adele St Unit 78
- 3145 E Scotts View Unit A
- 869 N Mallard St
- 2929 E Hamilton Ave
- 3124 E Jacaranda Ave
- 692 N Rancho Santiago Blvd
- 994 N Big Sky Ln
- 861 N Red Robin St
- 2705 E Orange Grove Ave
- 476 N Richard St
- 582 N Rick St
- 567 N La Nae Cir
- 591 N La Nae Cir
- 568 N Rick St
- 590 N Rick St
- 557 N La Nae Cir
- 590 N La Nae Cir
- 3918 E El Carmen Ave
- 3906 E El Carmen Ave
- 558 N Rick St
- 582 N La Nae Cir
- 568 N La Nae Cir
- 3930 E El Carmen Ave
- 3844 E El Carmen Ave
- 545 N La Nae Cir
- 558 N La Nae Cir
- 591 N Rick St
- 546 N Rick St
- 3940 E El Carmen Ave
- 3836 E El Carmen Ave