581 Story St Nipomo, CA 93444
Estimated Value: $826,000 - $912,000
3
Beds
3
Baths
1,750
Sq Ft
$497/Sq Ft
Est. Value
About This Home
This home is located at 581 Story St, Nipomo, CA 93444 and is currently estimated at $869,949, approximately $497 per square foot. 581 Story St is a home located in San Luis Obispo County with nearby schools including Dorothea Lange Elementary School, Mesa Middle School, and Nipomo High School.
Ownership History
Date
Name
Owned For
Owner Type
Purchase Details
Closed on
Mar 15, 2024
Sold by
Stevenson Barbara A
Bought by
Barbara Ann Stevenson Revocable Trust and Stevenson
Current Estimated Value
Purchase Details
Closed on
Mar 21, 2002
Sold by
Bell Jack M and Bell Olga Iris
Bought by
Stevenson Jesse and Stevenson Barbara A
Home Financials for this Owner
Home Financials are based on the most recent Mortgage that was taken out on this home.
Original Mortgage
$215,000
Interest Rate
5.87%
Purchase Details
Closed on
Dec 7, 2000
Sold by
Grce Sidney L and Grce Margaret C
Bought by
Bell Jack M and Bell Olga Iris
Home Financials for this Owner
Home Financials are based on the most recent Mortgage that was taken out on this home.
Original Mortgage
$290,625
Interest Rate
6.98%
Create a Home Valuation Report for This Property
The Home Valuation Report is an in-depth analysis detailing your home's value as well as a comparison with similar homes in the area
Home Values in the Area
Average Home Value in this Area
Purchase History
| Date | Buyer | Sale Price | Title Company |
|---|---|---|---|
| Barbara Ann Stevenson Revocable Trust | -- | None Listed On Document | |
| Barbara Ann Stevenson Revocable Trust | -- | None Listed On Document | |
| Barbara Ann Stevenson Revocable Trust | -- | None Listed On Document | |
| Stevenson Jesse | $335,000 | Chicago Title Co | |
| Bell Jack M | $387,500 | First American Title |
Source: Public Records
Mortgage History
| Date | Status | Borrower | Loan Amount |
|---|---|---|---|
| Previous Owner | Stevenson Jesse | $215,000 | |
| Previous Owner | Bell Jack M | $290,625 |
Source: Public Records
Tax History Compared to Growth
Tax History
| Year | Tax Paid | Tax Assessment Tax Assessment Total Assessment is a certain percentage of the fair market value that is determined by local assessors to be the total taxable value of land and additions on the property. | Land | Improvement |
|---|---|---|---|---|
| 2025 | $5,258 | $518,330 | $251,127 | $267,203 |
| 2024 | $5,196 | $508,167 | $246,203 | $261,964 |
| 2023 | $5,196 | $498,204 | $241,376 | $256,828 |
| 2022 | $5,116 | $488,437 | $236,644 | $251,793 |
| 2021 | $5,106 | $478,860 | $232,004 | $246,856 |
| 2020 | $5,047 | $473,951 | $229,626 | $244,325 |
| 2019 | $5,014 | $464,659 | $225,124 | $239,535 |
| 2018 | $4,953 | $455,549 | $220,710 | $234,839 |
| 2017 | $4,859 | $446,618 | $216,383 | $230,235 |
| 2016 | $4,581 | $437,862 | $212,141 | $225,721 |
| 2015 | $4,514 | $431,286 | $208,955 | $222,331 |
| 2014 | $4,345 | $422,838 | $204,862 | $217,976 |
Source: Public Records
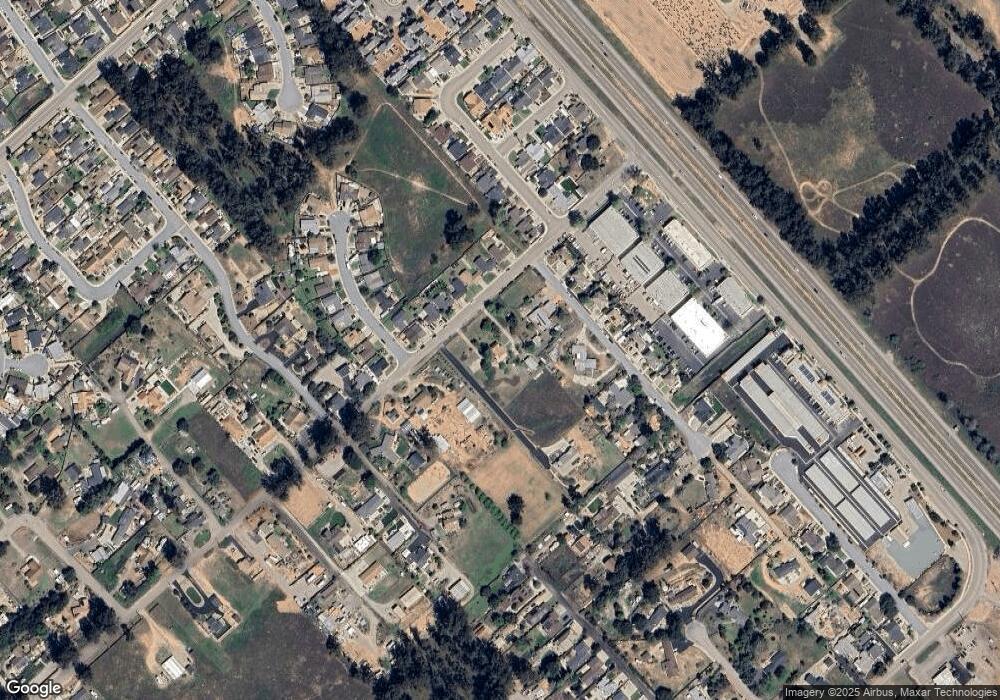
Map
Nearby Homes
- 725 Monarch Ln
- 424 Bermuda Place
- 626 Juno Ct
- 450 Avenida de Socios Unit 12
- 368 Avenida de Amigos
- 483 Violet Ave
- 522 Higos Way
- 525 Grande Ave Unit D
- 840 Story St
- 232 Scarlett Cir
- Mesa Plan at Hill Street Terraces - Hill Street Series
- Pacific Plan at Hill Street Terraces - Hill Street Series
- Monarch Plan at Hill Street Terraces - Hill Street Series
- Rancho Plan at Hill Street Terraces - Hill Street Series
- Dana Plan at Hill Street Terraces - Hill Street Series
- 945 Jeanette Ln
- 680 Hill St
- 449 W Tefft St Unit 23
- 449 W Tefft St Unit 13
- 426 Polaris Dr