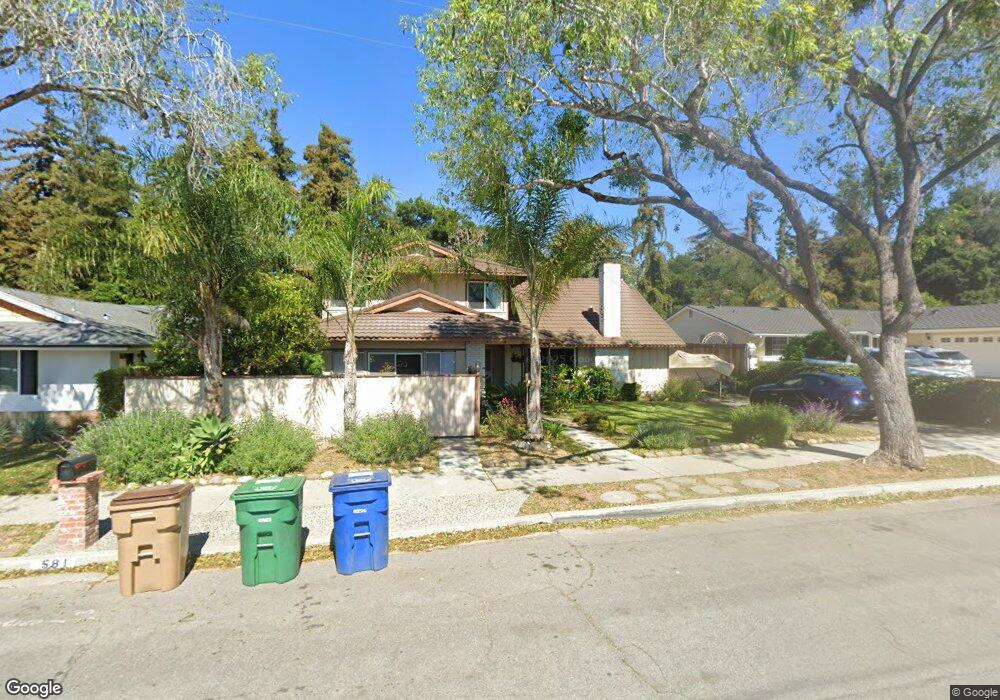
581 Windsor Ave Goleta, CA 93117
Estimated Value: $1,523,000 - $1,802,000
4
Beds
2
Baths
2,176
Sq Ft
$793/Sq Ft
Est. Value
About This Home
This home is located at 581 Windsor Ave, Goleta, CA 93117 and is currently estimated at $1,724,526, approximately $792 per square foot. 581 Windsor Ave is a home located in Santa Barbara County with nearby schools including Goleta Valley Junior High School, Dos Pueblos Senior High School, and Montessori Center School of Santa Barbara.
Ownership History
Date
Name
Owned For
Owner Type
Purchase Details
Closed on
Sep 1, 2017
Sold by
Oettinger David
Bought by
Oettinger David
Current Estimated Value
Home Financials for this Owner
Home Financials are based on the most recent Mortgage that was taken out on this home.
Original Mortgage
$254,375
Outstanding Balance
$213,664
Interest Rate
4.12%
Mortgage Type
FHA
Estimated Equity
$1,510,862
Purchase Details
Closed on
Aug 18, 2017
Sold by
Augustus Diane
Bought by
Oettinger David
Home Financials for this Owner
Home Financials are based on the most recent Mortgage that was taken out on this home.
Original Mortgage
$254,375
Outstanding Balance
$213,664
Interest Rate
4.12%
Mortgage Type
FHA
Estimated Equity
$1,510,862
Purchase Details
Closed on
May 1, 1998
Sold by
Oettinger Joseph T and Oettinger Yvonne D
Bought by
Oettinger Joseph T and Oettinger Yvonne D
Create a Home Valuation Report for This Property
The Home Valuation Report is an in-depth analysis detailing your home's value as well as a comparison with similar homes in the area
Home Values in the Area
Average Home Value in this Area
Purchase History
| Date | Buyer | Sale Price | Title Company |
|---|---|---|---|
| Oettinger David | -- | First American Title Company | |
| Oettinger David | -- | None Available | |
| Oettinger Joseph T | -- | -- |
Source: Public Records
Mortgage History
| Date | Status | Borrower | Loan Amount |
|---|---|---|---|
| Open | Oettinger David | $254,375 |
Source: Public Records
Tax History
| Year | Tax Paid | Tax Assessment Tax Assessment Total Assessment is a certain percentage of the fair market value that is determined by local assessors to be the total taxable value of land and additions on the property. | Land | Improvement |
|---|---|---|---|---|
| 2025 | $1,936 | $126,799 | $32,919 | $93,880 |
| 2023 | $1,936 | $121,878 | $31,642 | $90,236 |
| 2022 | $1,887 | $119,489 | $31,022 | $88,467 |
| 2021 | $1,861 | $117,147 | $30,414 | $86,733 |
| 2020 | $1,826 | $115,947 | $30,103 | $85,844 |
| 2019 | $1,802 | $113,674 | $29,513 | $84,161 |
| 2018 | $1,758 | $111,446 | $28,935 | $82,511 |
| 2017 | $1,723 | $109,262 | $28,368 | $80,894 |
| 2016 | $1,593 | $107,120 | $27,812 | $79,308 |
| 2014 | $1,586 | $103,446 | $26,859 | $76,587 |
Source: Public Records
Map
Nearby Homes
- 6281 Covington Way
- 0 N Fairview Ave Unit SR24087795
- 00 N Fairview Ave
- 5820 Encina Rd Unit 1
- 5805 Berkeley Rd
- 23 Magnolia Ave
- 5859 Mandarin Dr
- 6658 Sand Castle Place
- 5710 Stow Canyon Rd
- 604 Dara Rd
- 520 Pine Ave Unit 4
- 520 Pine Ave Unit 5
- 520 Pine Ave Unit Spc 75
- 5960 Matthews St
- 5514 Capellina Way
- 345 Kellogg Way Unit 18
- 345 Kellogg Way Unit 2
- 507 Bolinas Way Unit 103
- 1000 Calle Real
- 29 Dearborn Place Unit 7
- 571 Windsor Ave
- 593 Windsor Ave
- 559 Windsor Ave
- 576 Windsor Ave
- 6295 Stow Canyon Rd
- 607 Windsor Ave
- 566 Windsor Ave
- 547 Windsor Ave
- 556 Windsor Ave
- 6291 Stow Canyon Rd
- 619 Windsor Ave
- 6296 Stow Canyon Rd
- 544 Windsor Ave
- 545 Sussex Ct
- 537 Windsor Ave
- 622 Windsor Ave
- 6287 Stow Canyon Rd
- 631 Windsor Ave
- 6288 Stow Canyon Rd
- 531 Sussex Ct
Your Personal Tour Guide
Ask me questions while you tour the home.