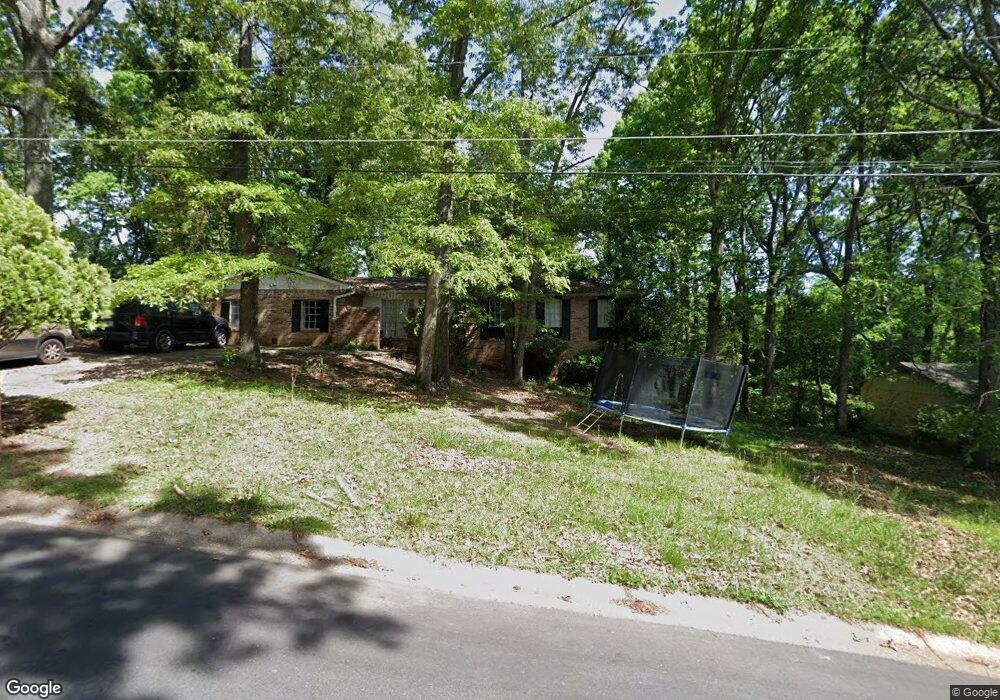
5810 Oakleaf Dr Stone Mountain, GA 30087
Estimated Value: $227,668 - $365,000
3
Beds
2
Baths
1,902
Sq Ft
$147/Sq Ft
Est. Value
About This Home
This home is located at 5810 Oakleaf Dr, Stone Mountain, GA 30087 and is currently estimated at $278,917, approximately $146 per square foot. 5810 Oakleaf Dr is a home located in DeKalb County with nearby schools including Pine Ridge Elementary School, Stephenson Middle School, and Stephenson High School.
Ownership History
Date
Name
Owned For
Owner Type
Purchase Details
Closed on
Mar 11, 2010
Sold by
Nora Properties Inc
Bought by
Global Inv Consulting Group In
Current Estimated Value
Purchase Details
Closed on
Mar 9, 2010
Sold by
Federal Natl Mtg Assn Fnma
Bought by
Nora Properties Inc
Purchase Details
Closed on
Oct 6, 2009
Sold by
Phh Mortgage Corp
Bought by
Federal Natl Mtg Assn Fnma
Purchase Details
Closed on
Oct 13, 2006
Sold by
Thomas Delroy
Bought by
Thomas Delroy and Morgan Rhonda
Home Financials for this Owner
Home Financials are based on the most recent Mortgage that was taken out on this home.
Original Mortgage
$135,000
Interest Rate
6.57%
Mortgage Type
New Conventional
Purchase Details
Closed on
Mar 14, 2001
Sold by
Sutton Charles A
Bought by
Morgan Rhonda
Home Financials for this Owner
Home Financials are based on the most recent Mortgage that was taken out on this home.
Original Mortgage
$114,850
Interest Rate
7.11%
Mortgage Type
New Conventional
Create a Home Valuation Report for This Property
The Home Valuation Report is an in-depth analysis detailing your home's value as well as a comparison with similar homes in the area
Home Values in the Area
Average Home Value in this Area
Purchase History
| Date | Buyer | Sale Price | Title Company |
|---|---|---|---|
| Global Inv Consulting Group In | -- | -- | |
| Nora Properties Inc | -- | -- | |
| Federal Natl Mtg Assn Fnma | -- | -- | |
| Phh Mortgage Corp | $143,843 | -- | |
| Thomas Delroy | -- | -- | |
| Morgan Rhonda | $120,900 | -- |
Source: Public Records
Mortgage History
| Date | Status | Borrower | Loan Amount |
|---|---|---|---|
| Previous Owner | Thomas Delroy | $135,000 | |
| Previous Owner | Morgan Rhonda | $114,850 |
Source: Public Records
Tax History
| Year | Tax Paid | Tax Assessment Tax Assessment Total Assessment is a certain percentage of the fair market value that is determined by local assessors to be the total taxable value of land and additions on the property. | Land | Improvement |
|---|---|---|---|---|
| 2025 | $4,228 | $86,000 | $17,200 | $68,800 |
| 2024 | $4,324 | $88,280 | $17,480 | $70,800 |
| 2023 | $4,324 | $62,160 | $11,480 | $50,680 |
Source: Public Records
Map
Nearby Homes
- 5809 Oakleaf Way
- 447 Sherwood Cir
- 577 Simone Way
- 611 Navarre Dr
- 5802 Simone Dr Unit 4
- 5900 Simone Dr
- 442 Mountain Park Trail
- 559 Pennybrook Ln
- 725 Navarre Dr
- 5651 Wells Cir
- 5641 Clifton Place
- 5707 Wells Cir
- 5745 Walter Trail
- 632 Grande View Unit 2
- 5713 Wells Cir
- 5722 Wells Cir
- 5743 Wells Cir
- 5580 Stonington Trace Pkwy
- 512 Ryan Place
- 621 Lakewater View Dr Unit 1
- 5818 Oakleaf Dr
- 5819 Navarre Ct
- 5811 Navarre Ct
- 5809 Oakleaf Dr
- 5831 Navarre Ct
- 5824 Oakleaf Dr
- 460 Navarre Dr
- 5817 Oakleaf Dr
- 5801 Oakleaf Dr
- 450 Navarre Dr Unit 1
- 5823 Oakleaf Dr
- 5832 Oakleaf Dr
- 478 Navarre Dr
- 5833 Oakleaf Dr
- 5808 Duchess Ct Unit 1
- 5828 Navarre Ct Unit 1
- 5808 Navarre Ct
- 5800 Duchess Ct
- 5840 Oakleaf Dr Unit 3
- 432 Navarre Dr
Your Personal Tour Guide
Ask me questions while you tour the home.