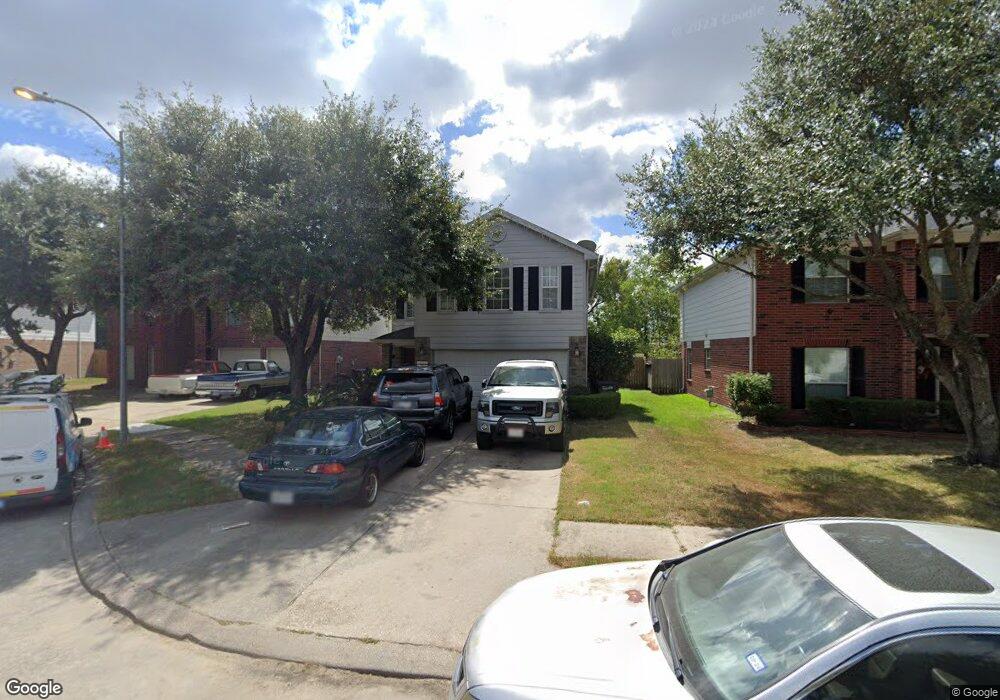
5811 Logancrest Ln Houston, TX 77086
North Houston NeighborhoodEstimated Value: $239,000 - $274,000
4
Beds
3
Baths
1,948
Sq Ft
$131/Sq Ft
Est. Value
About This Home
This home is located at 5811 Logancrest Ln, Houston, TX 77086 and is currently estimated at $255,204, approximately $131 per square foot. 5811 Logancrest Ln is a home located in Harris County with nearby schools including Kujawa EC/Pre-K/K School, Wilson Intermediate School, and Shotwell Middle School.
Ownership History
Date
Name
Owned For
Owner Type
Purchase Details
Closed on
Mar 31, 2021
Sold by
Ortega Ignacio and Palacios Maria Elena
Bought by
Ortega Edgar Alberto
Current Estimated Value
Home Financials for this Owner
Home Financials are based on the most recent Mortgage that was taken out on this home.
Original Mortgage
$161,500
Outstanding Balance
$145,342
Interest Rate
2.8%
Mortgage Type
New Conventional
Estimated Equity
$109,862
Purchase Details
Closed on
Aug 1, 2015
Sold by
1701 Bingle Llc
Bought by
Orosio Rodriguez Jose Alberto
Home Financials for this Owner
Home Financials are based on the most recent Mortgage that was taken out on this home.
Original Mortgage
$25,200
Interest Rate
3.98%
Mortgage Type
Purchase Money Mortgage
Purchase Details
Closed on
Aug 21, 2002
Sold by
Kb Home Lone Star Lp
Bought by
Ortega Ignacio
Home Financials for this Owner
Home Financials are based on the most recent Mortgage that was taken out on this home.
Original Mortgage
$109,990
Interest Rate
6.47%
Create a Home Valuation Report for This Property
The Home Valuation Report is an in-depth analysis detailing your home's value as well as a comparison with similar homes in the area
Home Values in the Area
Average Home Value in this Area
Purchase History
| Date | Buyer | Sale Price | Title Company |
|---|---|---|---|
| Ortega Edgar Alberto | -- | Homeland Title Company | |
| Orosio Rodriguez Jose Alberto | -- | None Available | |
| Ortega Ignacio | -- | First American Title |
Source: Public Records
Mortgage History
| Date | Status | Borrower | Loan Amount |
|---|---|---|---|
| Open | Ortega Edgar Alberto | $161,500 | |
| Previous Owner | Orosio Rodriguez Jose Alberto | $25,200 | |
| Previous Owner | Ortega Ignacio | $109,990 |
Source: Public Records
Tax History Compared to Growth
Tax History
| Year | Tax Paid | Tax Assessment Tax Assessment Total Assessment is a certain percentage of the fair market value that is determined by local assessors to be the total taxable value of land and additions on the property. | Land | Improvement |
|---|---|---|---|---|
| 2025 | $4,197 | $249,170 | $35,003 | $214,167 |
| 2024 | $4,197 | $239,707 | $35,003 | $204,704 |
| 2023 | $4,197 | $239,707 | $35,815 | $203,892 |
| 2022 | $5,078 | $208,601 | $27,550 | $181,051 |
| 2021 | $4,163 | $171,426 | $27,550 | $143,876 |
| 2020 | $4,430 | $164,091 | $27,550 | $136,541 |
| 2019 | $4,357 | $155,221 | $19,285 | $135,936 |
| 2018 | $1,992 | $138,731 | $19,285 | $119,446 |
| 2017 | $3,755 | $138,731 | $19,285 | $119,446 |
| 2016 | $3,555 | $131,368 | $19,285 | $112,083 |
| 2015 | $2,685 | $117,768 | $19,285 | $98,483 |
| 2014 | $2,685 | $99,096 | $19,285 | $79,811 |
Source: Public Records
Map
Nearby Homes
- 00 Essie Rd
- 5914 Stirring Winds Ln
- 12623 Ann Louise Rd
- 00 Romona Blvd
- 6411 Halstead Meadows Cir
- 10730 Antoine Dr
- 5930 Killough St
- 3265 Frick Rd
- 6011 Killough St
- 5626 Spindle Dr
- 12026 Madison Oak St
- 3127 Frick Rd
- 6706 Redding Springs Ln
- 12042 Mallard Stream Ct
- 10809 W Montgomery Rd
- 2934 Valiant Scene Ct
- 12610 Twilight Bend Ct
- 12006 Mallard Stream Ct
- 12015 Audubon Hill Ct
- 0 Tomball Pkwy
- 5815 Logancrest Ln
- 5807 Logancrest Ln
- 5819 Logancrest Ln
- 5803 Logancrest Ln
- 5823 Logancrest Ln
- 5814 Logancrest Ln
- 9806 Golden Prairie Ln
- 9802 Golden Prairie Ln
- 9810 Golden Prairie Ln
- 5827 Logancrest Ln
- 5818 Logancrest Ln
- 9814 Golden Prairie Ln
- 5822 Logancrest Ln
- 5831 Logancrest Ln
- 9818 Golden Prairie Ln
- 5826 Logancrest Ln
- 12411 Mosielee St
- 12411 Mosielee St
- 9827 Golden Prairie Ln
- 9822 Golden Prairie Ln