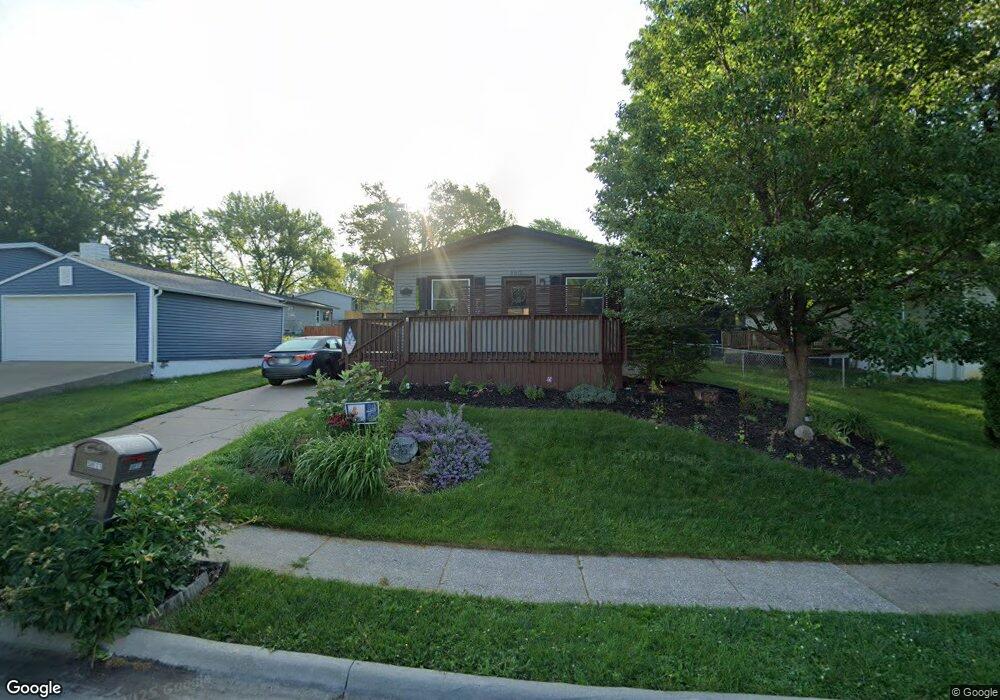
5811 N Linwood Ave Davenport, IA 52806
North Side NeighborhoodEstimated Value: $149,275 - $170,000
3
Beds
1
Bath
864
Sq Ft
$188/Sq Ft
Est. Value
About This Home
This home is located at 5811 N Linwood Ave, Davenport, IA 52806 and is currently estimated at $162,569, approximately $188 per square foot. 5811 N Linwood Ave is a home located in Scott County with nearby schools including Martin Luther King Jr. Elementary School, Truman Elementary School, and Cumberland Hall School.
Ownership History
Date
Name
Owned For
Owner Type
Purchase Details
Closed on
Jul 16, 2009
Sold by
Schrodt Amanda and Columbus Amanda G
Bought by
Thomasa Erica M and Thomas Jason L
Current Estimated Value
Home Financials for this Owner
Home Financials are based on the most recent Mortgage that was taken out on this home.
Original Mortgage
$90,333
Outstanding Balance
$59,640
Interest Rate
5.62%
Mortgage Type
FHA
Estimated Equity
$102,929
Purchase Details
Closed on
Jul 2, 2007
Sold by
Watts Walter A and Watts Jenny A
Bought by
Columus Amanda G and Columbus Mikel J
Home Financials for this Owner
Home Financials are based on the most recent Mortgage that was taken out on this home.
Original Mortgage
$87,500
Interest Rate
6.71%
Mortgage Type
New Conventional
Create a Home Valuation Report for This Property
The Home Valuation Report is an in-depth analysis detailing your home's value as well as a comparison with similar homes in the area
Home Values in the Area
Average Home Value in this Area
Purchase History
| Date | Buyer | Sale Price | Title Company |
|---|---|---|---|
| Thomasa Erica M | $92,000 | None Available | |
| Columus Amanda G | $87,500 | None Available |
Source: Public Records
Mortgage History
| Date | Status | Borrower | Loan Amount |
|---|---|---|---|
| Open | Thomasa Erica M | $90,333 | |
| Previous Owner | Columus Amanda G | $87,500 |
Source: Public Records
Tax History Compared to Growth
Tax History
| Year | Tax Paid | Tax Assessment Tax Assessment Total Assessment is a certain percentage of the fair market value that is determined by local assessors to be the total taxable value of land and additions on the property. | Land | Improvement |
|---|---|---|---|---|
| 2025 | $2,418 | $156,220 | $29,800 | $126,420 |
| 2024 | $2,242 | $145,560 | $29,800 | $115,760 |
| 2023 | $2,450 | $138,980 | $29,800 | $109,180 |
| 2022 | $2,352 | $123,540 | $24,830 | $98,710 |
| 2021 | $2,352 | $118,600 | $24,830 | $93,770 |
| 2020 | $2,260 | $112,840 | $24,830 | $88,010 |
| 2019 | $2,248 | $108,730 | $24,830 | $83,900 |
| 2018 | $2,196 | $108,730 | $24,830 | $83,900 |
| 2017 | $605 | $108,730 | $24,830 | $83,900 |
| 2016 | $2,064 | $102,970 | $0 | $0 |
| 2015 | $2,064 | $97,370 | $0 | $0 |
| 2014 | $1,970 | $97,370 | $0 | $0 |
| 2013 | $1,930 | $0 | $0 | $0 |
| 2012 | -- | $91,350 | $22,900 | $68,450 |
Source: Public Records
Map
Nearby Homes
- 2434 W 59th St
- 2514 W 60th St
- 2508 W 60th Place
- 5556 N Thornwood Ave
- 5812 Hillandale Rd
- 5824 Hillandale Rd
- 5904 Hillandale Rd
- 6050 Hillandale Rd
- 2620 W 54th St
- 2822 High Point Dr
- 1927 W 55th St
- 6504 Cedar St
- 5312 Hillandale Rd
- 2714 W 66th St
- 5109 N Pine St
- 5510 N Division St
- 2110 W 68th St
- Lot 65 W 66th St
- 5436 N Division St
- 2012 W 68th St
- 2434 W 58th St
- 5823 N Linwood Ave
- 2433 W 59th St
- 2430 W 58th St
- 2429 W 59th St
- 5806 N Linwood Ave
- 5810 N Linwood Ave
- 2424 W 58th St
- 5724 N Linwood Ave
- 5822 N Linwood Ave
- 2423 W 59th St
- 5814 N Linwood Ave
- 2433 W 58th St
- 2420 W 58th St
- 2509 W 59th St
- 2419 W 59th St
- 2423 W 58th St
- 5716 N Linwood Ave
- 5905 N Linwood Ave
- 2430 W 59th St