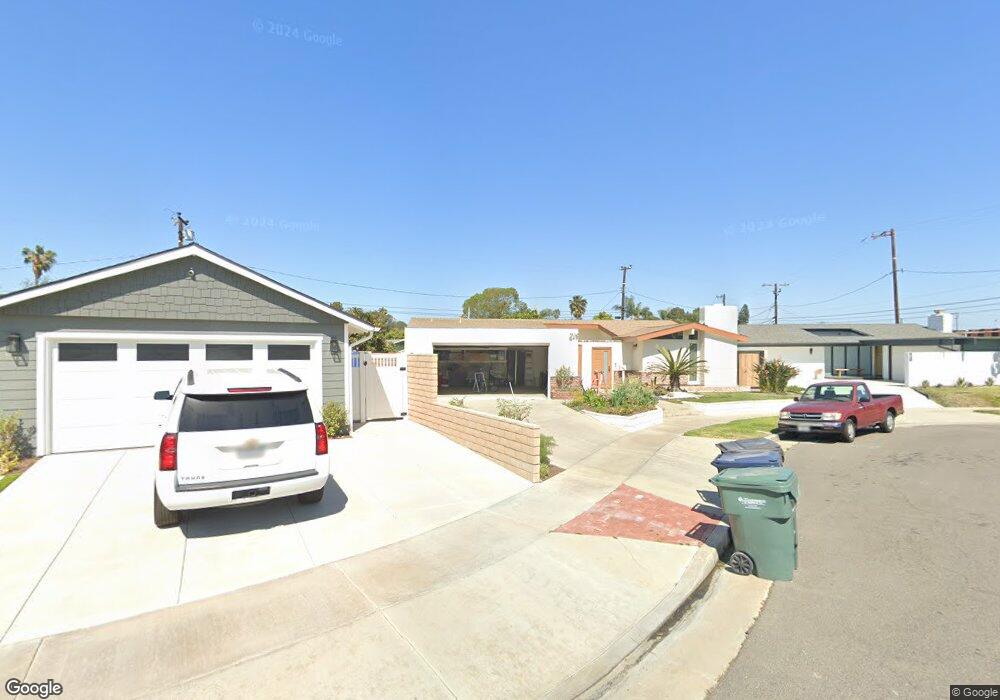
5811 View Cir Huntington Beach, CA 92649
Estimated Value: $1,186,000 - $1,292,000
4
Beds
2
Baths
1,509
Sq Ft
$825/Sq Ft
Est. Value
About This Home
This home is located at 5811 View Cir, Huntington Beach, CA 92649 and is currently estimated at $1,244,731, approximately $824 per square foot. 5811 View Cir is a home located in Orange County with nearby schools including Circle View Elementary School, Spring View Middle School, and Marina High School.
Ownership History
Date
Name
Owned For
Owner Type
Purchase Details
Closed on
Mar 5, 2015
Sold by
Cefalu Peter
Bought by
Cefalu Peter and Cefalu Alison Gail
Current Estimated Value
Purchase Details
Closed on
Jul 23, 2004
Sold by
Cefalu Peter
Bought by
Cefalu Peter
Purchase Details
Closed on
Sep 9, 1994
Sold by
Cefalu Peter and Cefalu Joseph
Bought by
Cefalu Peter
Purchase Details
Closed on
Nov 23, 1993
Sold by
Cefalu Claudia
Bought by
Cefalu Joseph
Home Financials for this Owner
Home Financials are based on the most recent Mortgage that was taken out on this home.
Original Mortgage
$186,000
Interest Rate
6.85%
Purchase Details
Closed on
Nov 16, 1993
Sold by
Fryar Celeste C
Bought by
Fryar Robert P and Fryar Patricia E
Home Financials for this Owner
Home Financials are based on the most recent Mortgage that was taken out on this home.
Original Mortgage
$186,000
Interest Rate
6.85%
Create a Home Valuation Report for This Property
The Home Valuation Report is an in-depth analysis detailing your home's value as well as a comparison with similar homes in the area
Home Values in the Area
Average Home Value in this Area
Purchase History
| Date | Buyer | Sale Price | Title Company |
|---|---|---|---|
| Cefalu Peter | -- | None Available | |
| Cefalu Peter | -- | Alliance Title Company | |
| Cefalu Peter | -- | Alliance Title Company | |
| Cefalu Peter | -- | -- | |
| Cefalu Joseph | -- | Gateway Title Company | |
| Cefalu Peter | $232,500 | Gateway Title Company | |
| Fryar Robert P | $155,000 | Gateway Title Company |
Source: Public Records
Mortgage History
| Date | Status | Borrower | Loan Amount |
|---|---|---|---|
| Closed | Cefalu Peter | $186,000 |
Source: Public Records
Tax History Compared to Growth
Tax History
| Year | Tax Paid | Tax Assessment Tax Assessment Total Assessment is a certain percentage of the fair market value that is determined by local assessors to be the total taxable value of land and additions on the property. | Land | Improvement |
|---|---|---|---|---|
| 2025 | $4,585 | $390,519 | $278,934 | $111,585 |
| 2024 | $4,585 | $382,862 | $273,464 | $109,398 |
| 2023 | $4,479 | $375,355 | $268,102 | $107,253 |
| 2022 | $4,412 | $367,996 | $262,846 | $105,150 |
| 2021 | $4,332 | $360,781 | $257,692 | $103,089 |
| 2020 | $4,284 | $357,082 | $255,050 | $102,032 |
| 2019 | $4,212 | $350,081 | $250,049 | $100,032 |
| 2018 | $4,119 | $343,217 | $245,146 | $98,071 |
| 2017 | $4,054 | $336,488 | $240,339 | $96,149 |
| 2016 | $3,892 | $329,891 | $235,627 | $94,264 |
| 2015 | $3,758 | $324,936 | $232,087 | $92,849 |
| 2014 | $3,683 | $318,571 | $227,540 | $91,031 |
Source: Public Records
Map
Nearby Homes
- 17042 Twain Ln
- 6051 Summerdale Dr
- 17071 Pinehurst Ln
- 17301 Juniper Ln
- 16542 Los Verdes Ln
- 16652 Busby Ln
- 6301 Warner Ave Unit 88
- 6301 Warner Ave Unit 40
- 5591 Heil Ave
- 17231 Lido Ln
- 6171 Gumm Dr
- 6292 Heil Ave
- 5262 Glenroy Dr
- 5241 Glenroy Dr
- 6351 Gloria Dr
- 17442 Coronado Ln
- 16261 Angler Ln
- 17202 Corbina Ln Unit 108
- 16832 Roosevelt Ln
- 16401 Mercier Ln