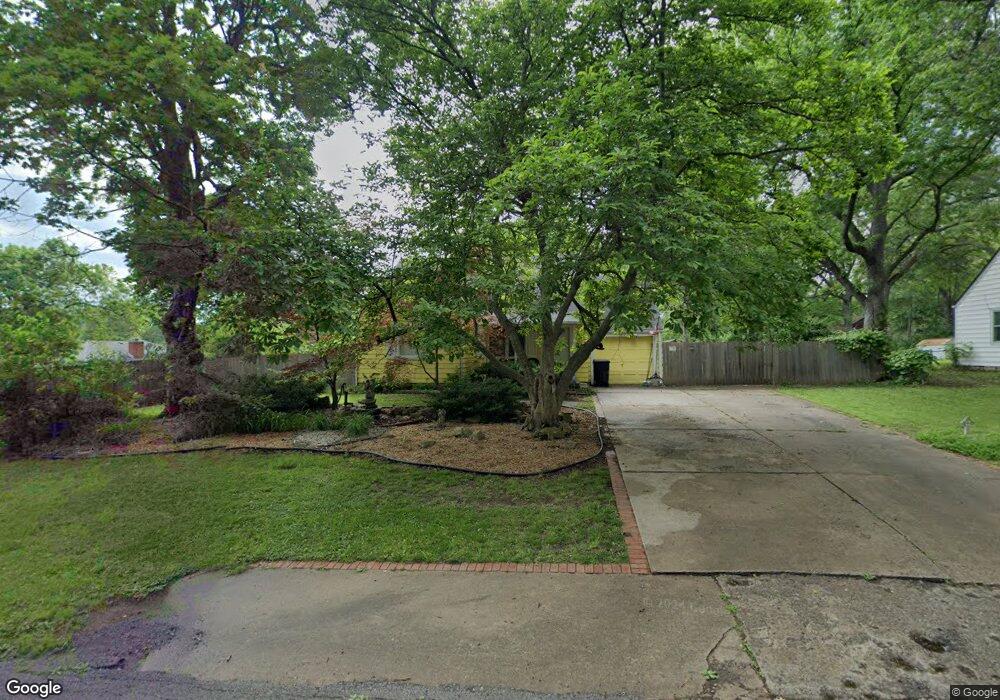
5812 Harvard Ave Raytown, MO 64133
Estimated Value: $176,000 - $193,000
About This Home
This home is located at 5812 Harvard Ave, Raytown, MO 64133 and is currently estimated at $183,361, approximately $203 per square foot. 5812 Harvard Ave is a home located in Jackson County with nearby schools including Norfleet Elementary School, Raytown Central Middle School, and Raytown South High School.
Ownership History
We collect this data history from publicly available records. To have your information removed, we recommend requesting removal directly through your county’s website.
Purchase Details
Home Financials for this Owner
Home Financials are based on the most recent Mortgage that was taken out on this home.Purchase Details
Home Financials for this Owner
Home Financials are based on the most recent Mortgage that was taken out on this home.Purchase Details
Home Financials for this Owner
Home Financials are based on the most recent Mortgage that was taken out on this home.Home Values in the Area
Average Home Value in this Area
Purchase History
We collect this data history from publicly available records. To have your information removed, we recommend requesting removal directly through your county’s website.
| Date | Buyer | Sale Price | Title Company |
|---|---|---|---|
| -- | Cbkc Title & Escrow Llc | ||
| -- | First American | ||
| -- | Ati Title Company |
Mortgage History
We collect this data history from publicly available records. To have your information removed, we recommend requesting removal directly through your county’s website.
| Date | Status | Borrower | Loan Amount |
|---|---|---|---|
| Previous Owner | $83,936 | ||
| Previous Owner | $90,286 | ||
| Previous Owner | $71,200 |
Tax History
We collect this data history from publicly available records. To have your information removed, we recommend requesting removal directly through your county’s website.
| Year | Tax Paid | Tax Assessment Tax Assessment Total Assessment is a certain percentage of the fair market value that is determined by local assessors to be the total taxable value of land and additions on the property. | Land | Improvement |
|---|---|---|---|---|
| 2025 | $2,059 | $19,097 | $7,152 | $11,945 |
| 2024 | $2,045 | $22,829 | $8,957 | $13,872 |
| 2023 | $2,045 | $22,829 | $5,100 | $17,729 |
| 2022 | $1,358 | $14,440 | $7,600 | $6,840 |
| 2021 | $1,363 | $14,440 | $7,600 | $6,840 |
| 2020 | $1,369 | $14,362 | $7,600 | $6,762 |
| 2019 | $1,361 | $14,362 | $7,600 | $6,762 |
| 2018 | $1,126 | $12,305 | $2,999 | $9,306 |
| 2017 | $1,092 | $12,305 | $2,999 | $9,306 |
| 2016 | $1,092 | $11,997 | $3,523 | $8,474 |
| 2014 | $1,072 | $11,647 | $3,420 | $8,227 |
Map
- 6004 Harris Ave
- 11108 E 57th St
- 11003 E 60th Terrace
- 5809 Ralston Ave
- 10803 E 60th Terrace
- 6100 Englewood Ave
- 5608 Woodson Rd
- 6128 Ralston Ave
- 11304 E 55th Terrace
- 11701 E 60th St
- 5805 Ridgeway Ave
- 11308 E 62nd St
- 11401 E 61st Terrace
- 5425 Appleton Ave
- 11604 E 61st Terrace
- 5433 Willow Ave
- 11902 E 59th Terrace
- 5521 Ash Ave
- 11601 E 62nd St
- 6305 Ralston Ave
- 5808 Harvard Ave
- 11006 E 59th St
- 11008 E 59th St
- 10915 E 58th St
- 5804 Harvard Ave
- 5821 Appleton Ave
- 10916 E 59th St
- 10912 E 59th St
- 5817 Harvard Ave
- 5809 Harvard Ave
- 5813 Appleton Ave
- 10909 E 58th Terrace
- 5800 Harvard Ave
- 5805 Harvard Ave
- 11104 E 59th St
- 10908 E 59th St
- 11011 E 59th St
- 5809 Appleton Ave
- 11001 E 59th St
- 10904 E 59th St
Ask me questions while you tour the home.