5812 Indian Warpath Rd Maryville, TN 37803
Lanier NeighborhoodEstimated payment $15,607/month
Highlights
- 76 Acre Lot
- Mountain View
- Partially Fenced Property
- Carpenters Elementary School Rated 9+
- Farm
- Lot Has A Rolling Slope
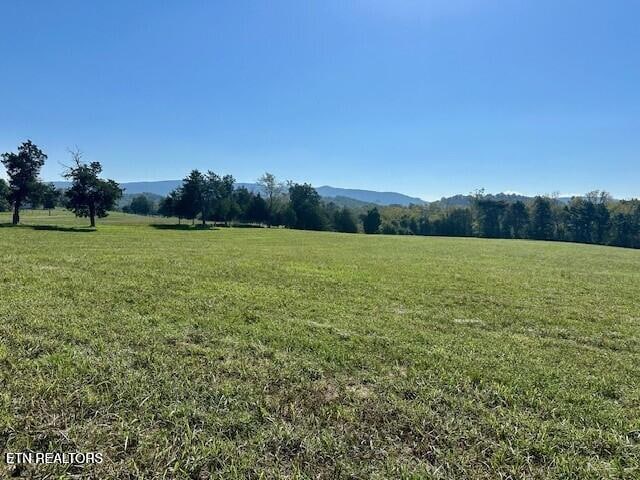
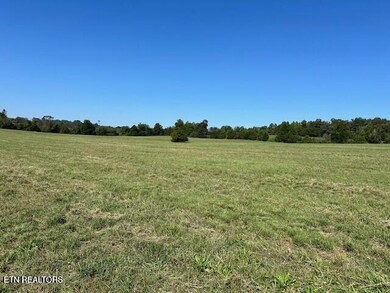
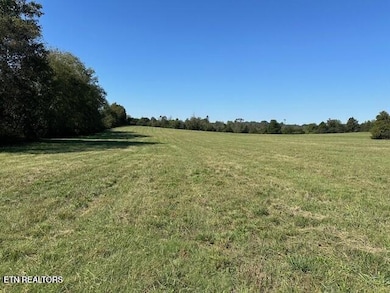
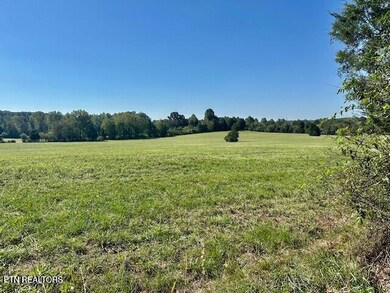
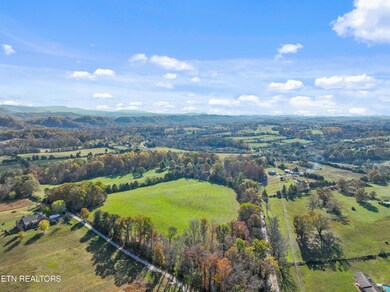
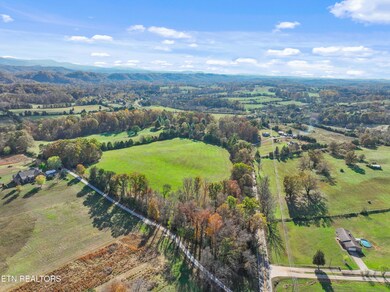
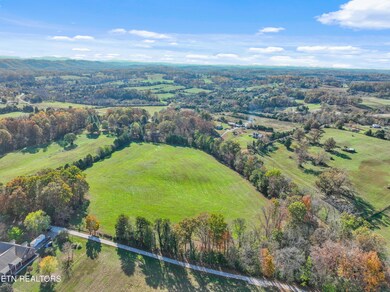
About This Lot
First time offered in 96 years!! This beautiful family farm covering 62.38 gently rolling acres is a must see. The entire property is zoned R-1. Beautiful wooded areas separate pastures, taking up 19 acres total. This farm is just minutes from the world famous 129-Dragon, and is just a short drive from lakes, mountains, shopping, and all that Maryville has to offer! A smaller acreage tract of 17.7 Acres is also available (other side of the road) and is sold separately - Tract 1. Do not drive in the fields with uncut hay.
Property Details
Property Type
- Land
Est. Annual Taxes
- $1,062
Lot Details
- 76 Acre Lot
- Property fronts a county road
- Partially Fenced Property
- Irregular Lot
- Lot Has A Rolling Slope
- Zoning described as Zoned Agricultural, Zoned Residential, Other
Additional Features
- Mountain Views
- Farm
Listing and Financial Details
- Assessor Parcel Number 111 126.00
Map
Home Values in the Area
Average Home Value in this Area
Tax History
| Year | Tax Paid | Tax Assessment Tax Assessment Total Assessment is a certain percentage of the fair market value that is determined by local assessors to be the total taxable value of land and additions on the property. | Land | Improvement |
|---|---|---|---|---|
| 2025 | $1,062 | $66,800 | $0 | $0 |
| 2024 | $1,062 | $66,800 | $53,900 | $12,900 |
| 2023 | $1,062 | $66,800 | $53,900 | $12,900 |
| 2022 | $1,283 | $51,925 | $44,825 | $7,100 |
| 2021 | $1,283 | $51,925 | $44,825 | $7,100 |
| 2020 | $1,283 | $51,925 | $44,825 | $7,100 |
| 2019 | $1,283 | $51,925 | $44,825 | $7,100 |
| 2018 | $1,150 | $46,575 | $39,525 | $7,050 |
| 2017 | $1,150 | $46,575 | $39,525 | $7,050 |
| 2016 | $1,150 | $46,575 | $39,525 | $7,050 |
| 2015 | $1,001 | $46,575 | $39,525 | $7,050 |
| 2014 | $833 | $46,575 | $39,525 | $7,050 |
| 2013 | $833 | $38,725 | $0 | $0 |
Property History
| Date | Event | Price | List to Sale | Price per Sq Ft |
|---|---|---|---|---|
| 11/11/2025 11/11/25 | For Sale | $749,900 | -74.6% | -- |
| 11/11/2025 11/11/25 | For Sale | $2,950,000 | -20.2% | -- |
| 11/11/2025 11/11/25 | For Sale | $3,699,000 | -- | -- |
Purchase History
| Date | Type | Sale Price | Title Company |
|---|---|---|---|
| Quit Claim Deed | -- | -- | |
| Quit Claim Deed | -- | -- | |
| Deed | -- | -- |
Source: East Tennessee REALTORS® MLS
MLS Number: 1321534
APN: 111-126.00
Disclaimer: Certain information contained herein is derived from information provided by parties other than Homes.com. All information provided is deemed reliable, but is not guaranteed to be accurate and should be independently verified.
![]() IDX information is provided exclusively for personal, non-commercial use, and may not be used for any purpose other than to identify prospective properties consumers may be interested in purchasing. Information is deemed reliable but not guaranteed.
IDX information is provided exclusively for personal, non-commercial use, and may not be used for any purpose other than to identify prospective properties consumers may be interested in purchasing. Information is deemed reliable but not guaranteed.
Listing Information presented by local MLS brokerage: Ten-X, LLC dba Homes.com, local broker - Arlene Richardson - 888-952-6393.
- 00 Calderwood Hwy
- 2419 Robin Ridge Dr
- 1403 Chickadee Cir
- 5907 Bingham Ln
- 1367 Warrior Path
- 2003 Reagan Mill Rd
- 2102 Calderwood Hwy
- 1250 Brick Mill Rd
- 1104 Stable Crossing
- 0 Lot 5--Hutton Ridge Rd
- 0 Lot 3-Hutton Ridge Rd
- 0 Lot 4--Hutton Ridge Rd
- 0 Lot 2--Hutton Ridge Rd
- Tract 2 Hutton Ridge Rd
- 0 Tract 2 Hutton Ridge Rd
- 6231 Bingham Ln
- 894 Brick Mill Rd
- 2939 Calderwood Hwy
- 5547 Hutton Ridge Rd
- 6056 Lanier Rd
- 7055 Tomotley Rd
- 2805 Big Bend Dr
- 3043 Best Rd
- 2811 Best Rd
- 100 Enterprise Way
- 1822 Hunters Hill Blvd
- 2713 Montvale Rd Unit 2713
- 2425 Hallerins Ct
- 1901 Scenic Dr
- 1033 Ruscello Dr
- 1019 Beech Tree Cove
- 1007 Huntington Place Dr
- 1000 Infinity Dr
- 2114 Post Oak Ln
- 1201 Camellia Trace
- 1000 Bridgeway Dr
- 150 Ellis St
- 159 Country Way Rd
- 109 Circle Dr Unit 117
- 116 Unole Trail
