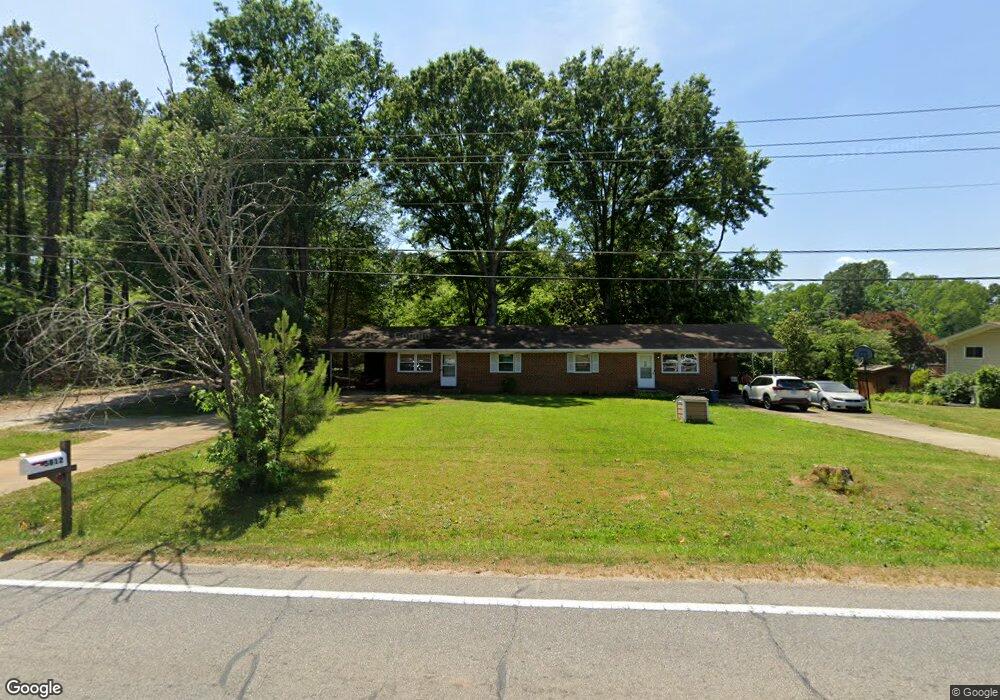
5812 Old Stage Rd Raleigh, NC 27603
Estimated Value: $252,000 - $454,000
--
Bed
2
Baths
1,728
Sq Ft
$195/Sq Ft
Est. Value
About This Home
This home is located at 5812 Old Stage Rd, Raleigh, NC 27603 and is currently estimated at $336,154, approximately $194 per square foot. 5812 Old Stage Rd is a home located in Wake County with nearby schools including Vandora Springs Elementary, North Garner Middle, and Garner High.
Ownership History
Date
Name
Owned For
Owner Type
Purchase Details
Closed on
Aug 6, 2021
Sold by
Furlough Charles E and Furlough Sandra G
Bought by
Furlough Daniel Charles and Furlough Caleb Samuel
Current Estimated Value
Home Financials for this Owner
Home Financials are based on the most recent Mortgage that was taken out on this home.
Original Mortgage
$180,000
Outstanding Balance
$35,050
Interest Rate
3%
Mortgage Type
Seller Take Back
Estimated Equity
$301,104
Purchase Details
Closed on
Nov 24, 2003
Sold by
Furlough Billy D and Furlough Ellen M
Bought by
Furlough Charles E and Furlough Sandra G
Home Financials for this Owner
Home Financials are based on the most recent Mortgage that was taken out on this home.
Original Mortgage
$39,000
Interest Rate
5.93%
Mortgage Type
Purchase Money Mortgage
Purchase Details
Closed on
Jan 13, 1994
Bought by
Furlough Charles E and Furlough Sandra G
Create a Home Valuation Report for This Property
The Home Valuation Report is an in-depth analysis detailing your home's value as well as a comparison with similar homes in the area
Home Values in the Area
Average Home Value in this Area
Purchase History
| Date | Buyer | Sale Price | Title Company |
|---|---|---|---|
| Furlough Daniel Charles | $200,000 | None Available | |
| Furlough Charles E | -- | -- | |
| Furlough Charles E | $85,000 | -- |
Source: Public Records
Mortgage History
| Date | Status | Borrower | Loan Amount |
|---|---|---|---|
| Open | Furlough Daniel Charles | $180,000 | |
| Previous Owner | Furlough Charles E | $39,000 |
Source: Public Records
Tax History Compared to Growth
Tax History
| Year | Tax Paid | Tax Assessment Tax Assessment Total Assessment is a certain percentage of the fair market value that is determined by local assessors to be the total taxable value of land and additions on the property. | Land | Improvement |
|---|---|---|---|---|
| 2025 | $1,570 | $239,212 | $108,900 | $130,312 |
| 2024 | $1,526 | $239,212 | $108,900 | $130,312 |
| 2023 | $1,453 | $181,243 | $50,000 | $131,243 |
| 2022 | $1,349 | $181,243 | $50,000 | $131,243 |
| 2021 | $1,314 | $181,243 | $50,000 | $131,243 |
| 2020 | $1,292 | $181,243 | $50,000 | $131,243 |
| 2019 | $1,111 | $131,097 | $32,000 | $99,097 |
| 2018 | $1,024 | $131,097 | $32,000 | $99,097 |
| 2017 | $972 | $131,097 | $32,000 | $99,097 |
| 2016 | $953 | $131,097 | $32,000 | $99,097 |
| 2015 | $920 | $126,685 | $40,000 | $86,685 |
| 2014 | $874 | $126,685 | $40,000 | $86,685 |
Source: Public Records
Map
Nearby Homes
- 725 Colonial Dr
- Juniper Plan at Rollman Farms - Townhomes
- Juniper End Unit Plan at Rollman Farms - Townhomes
- 116 Sunny Acres Rd
- 152 Sunny Acres Rd
- 156 Sunny Acres Rd
- 304 Grand Silo Rd
- 324 Grand Silo Rd
- 328 Grand Silo Rd
- 336 Grand Silo Rd
- 612 Lakeview Dr
- 612 Locust Ln
- 673 Pasture Ridge Rd
- 669 Pasture Ridge Rd
- 408 Grand Silo Rd
- 429 Grand Silo Rd
- 420 Grand Silo Rd
- 1341 Rollman Farm Rd
- 1313 Rollman Farm Rd
- 1336 Rollman Farm Rd
- 5808 Old Stage Rd
- 819 Woodland Rd
- 5819 Old Stage Rd
- 5700 Old Stage Rd
- 1109 Redford Dr
- 5711 Old Stage Rd
- 5816 Old Stage Rd
- 5900 Old Stage Rd
- 1113 Redford Dr
- 816 Woodland Rd
- 811 Woodland Rd
- 5622 Old Stage Rd
- 5703 Old Stage Rd
- 1117 Redford Dr
- 5906 Old Stage Rd
- 819 Colonial Dr
- 5701 Meadowbrook Rd
- 807 Woodland Rd Unit 3
- 807 Woodland Rd
- 815 Colonial Dr