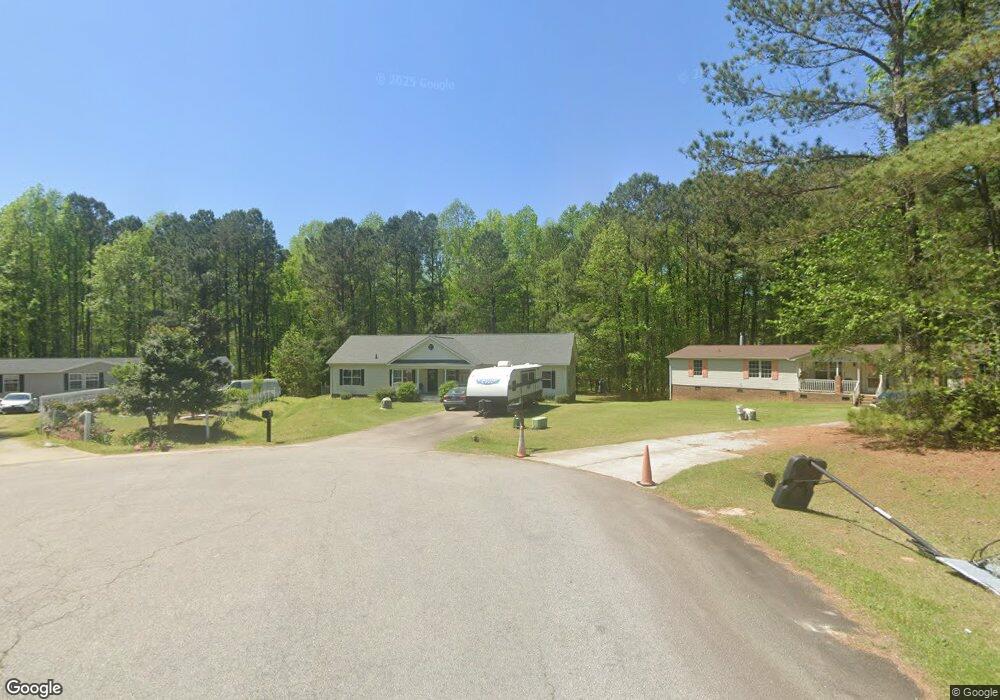
5812 Wakashan Cir Raleigh, NC 27603
Estimated Value: $304,000 - $336,000
3
Beds
2
Baths
2,014
Sq Ft
$159/Sq Ft
Est. Value
About This Home
This home is located at 5812 Wakashan Cir, Raleigh, NC 27603 and is currently estimated at $320,333, approximately $159 per square foot. 5812 Wakashan Cir is a home located in Wake County with nearby schools including Rand Road Elementary, North Garner Middle, and Garner High.
Ownership History
Date
Name
Owned For
Owner Type
Purchase Details
Closed on
Apr 20, 2018
Sold by
K & J Construction Co Llc
Bought by
Gaydos Robert A
Current Estimated Value
Home Financials for this Owner
Home Financials are based on the most recent Mortgage that was taken out on this home.
Original Mortgage
$184,848
Outstanding Balance
$159,040
Interest Rate
4.46%
Mortgage Type
New Conventional
Estimated Equity
$161,293
Purchase Details
Closed on
Dec 18, 2017
Sold by
Davis Derrick O and Davis Marlene A
Bought by
K & J Construction Company Llc
Purchase Details
Closed on
Jul 18, 2016
Sold by
Davis Marlene A
Bought by
Davis Marlene A
Purchase Details
Closed on
May 15, 2006
Sold by
Regal Homes Inc Of Raleigh
Bought by
Davis Derrick O and Davis Marlene A
Home Financials for this Owner
Home Financials are based on the most recent Mortgage that was taken out on this home.
Original Mortgage
$162,350
Interest Rate
6.39%
Mortgage Type
Construction
Create a Home Valuation Report for This Property
The Home Valuation Report is an in-depth analysis detailing your home's value as well as a comparison with similar homes in the area
Home Values in the Area
Average Home Value in this Area
Purchase History
| Date | Buyer | Sale Price | Title Company |
|---|---|---|---|
| Gaydos Robert A | $183,000 | None Available | |
| K & J Construction Company Llc | $127,500 | None Available | |
| Davis Marlene A | -- | None Available | |
| Davis Derrick O | $191,000 | None Available |
Source: Public Records
Mortgage History
| Date | Status | Borrower | Loan Amount |
|---|---|---|---|
| Open | Gaydos Robert A | $184,848 | |
| Previous Owner | Davis Derrick O | $162,350 |
Source: Public Records
Tax History Compared to Growth
Tax History
| Year | Tax Paid | Tax Assessment Tax Assessment Total Assessment is a certain percentage of the fair market value that is determined by local assessors to be the total taxable value of land and additions on the property. | Land | Improvement |
|---|---|---|---|---|
| 2025 | $2,314 | $358,693 | $100,000 | $258,693 |
| 2024 | $2,247 | $358,693 | $100,000 | $258,693 |
| 2023 | $1,700 | $215,422 | $34,000 | $181,422 |
| 2022 | $1,576 | $215,422 | $34,000 | $181,422 |
| 2021 | $1,534 | $215,422 | $34,000 | $181,422 |
| 2020 | $1,509 | $215,422 | $34,000 | $181,422 |
| 2019 | $1,312 | $158,212 | $28,000 | $130,212 |
| 2018 | $1,207 | $158,212 | $28,000 | $130,212 |
| 2017 | $1,145 | $158,212 | $28,000 | $130,212 |
| 2016 | $1,122 | $158,212 | $28,000 | $130,212 |
| 2015 | $1,162 | $164,487 | $32,000 | $132,487 |
| 2014 | -- | $164,487 | $32,000 | $132,487 |
Source: Public Records
Map
Nearby Homes
- 1021 Wintu Ct
- 6501 Rock Service Station Rd
- 6121 Catandpolly Ln
- 6313 Southern Charm Ln
- 6600 Rock Service Station Rd
- 6009 Swales Way
- 6109 Oak Passage Dr
- 1017 Azalea Garden Cir
- 6257 Oak Passage Dr
- 1025 Azalea Garden Cir
- 1033 Azalea Garden Cir
- 1037 Azalea Garden Cir
- 1041 Azalea Garden Cir
- 1045 Azalea Garden Cir
- 1053 Azalea Garden Cir
- 1057 Azalea Garden Cir
- 1061 Azalea Garden Cir
- 1065 Azalea Garden Cir
- 1069 Azalea Garden Cir
- 1101 Robinfield Dr
- 5813 Wakashan Cir
- 5808 Wakashan Cir
- 5804 Wakashan Cir
- 5809 Wakashan Cir
- 2004 McBurnie Dr
- 1001 Wintu Ct
- 5805 Wakashan Cir
- 1000 Wintu Ct
- 2016 McBurnie Dr
- 1200 Yakimas Rd
- 1005 Wintu Ct
- 2017 McBurnie Dr
- 1208 Yakimas Rd
- 1009 Wintu Ct
- 1116 Silver Farm Rd
- 1124 Silver Farm Rd
- 1212 Yakimas Rd
- 1120 Silver Farm Rd
- 1128 Silver Farm Rd
- 1132 Silver Farm Rd