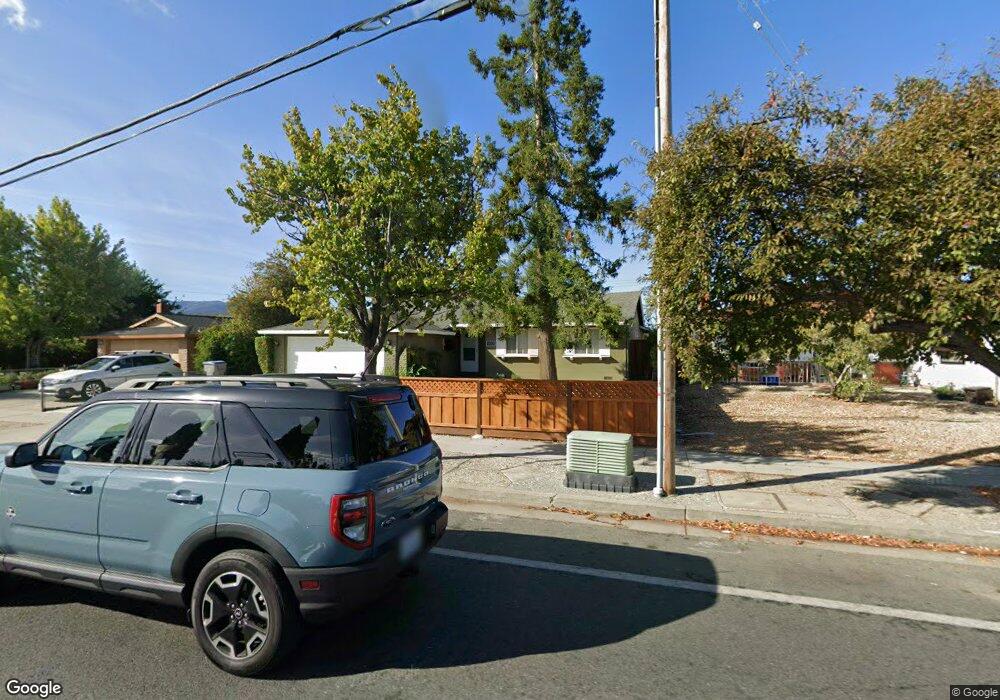
5813 Snell Ave San Jose, CA 95123
Comanche NeighborhoodEstimated Value: $1,193,000 - $1,316,000
3
Beds
2
Baths
1,208
Sq Ft
$1,060/Sq Ft
Est. Value
About This Home
This home is located at 5813 Snell Ave, San Jose, CA 95123 and is currently estimated at $1,280,067, approximately $1,059 per square foot. 5813 Snell Ave is a home located in Santa Clara County with nearby schools including Frost (Earl) Elementary School, Herman (Leonard) Intermediate School, and Santa Teresa High School.
Ownership History
Date
Name
Owned For
Owner Type
Purchase Details
Closed on
Aug 20, 2004
Sold by
Baker Joshua M and Baker Suzanne R
Bought by
Baker Joshua M and Baker Suzanne R
Current Estimated Value
Purchase Details
Closed on
May 23, 2002
Sold by
Okke Cheryl and Carabajal Ruey
Bought by
Baker Joshua M and Nielsen Suzanne R
Home Financials for this Owner
Home Financials are based on the most recent Mortgage that was taken out on this home.
Original Mortgage
$353,500
Outstanding Balance
$162,485
Interest Rate
8.2%
Estimated Equity
$1,117,582
Create a Home Valuation Report for This Property
The Home Valuation Report is an in-depth analysis detailing your home's value as well as a comparison with similar homes in the area
Home Values in the Area
Average Home Value in this Area
Purchase History
| Date | Buyer | Sale Price | Title Company |
|---|---|---|---|
| Baker Joshua M | -- | -- | |
| Baker Joshua M | $400,000 | North American Title Co |
Source: Public Records
Mortgage History
| Date | Status | Borrower | Loan Amount |
|---|---|---|---|
| Open | Baker Joshua M | $353,500 | |
| Closed | Baker Joshua M | $40,000 |
Source: Public Records
Tax History
| Year | Tax Paid | Tax Assessment Tax Assessment Total Assessment is a certain percentage of the fair market value that is determined by local assessors to be the total taxable value of land and additions on the property. | Land | Improvement |
|---|---|---|---|---|
| 2025 | $8,753 | $590,895 | $265,903 | $324,992 |
| 2024 | $8,753 | $579,310 | $260,690 | $318,620 |
| 2023 | $8,605 | $567,952 | $255,579 | $312,373 |
| 2022 | $8,552 | $556,817 | $250,568 | $306,249 |
| 2021 | $8,408 | $545,900 | $245,655 | $300,245 |
| 2020 | $8,211 | $540,304 | $243,137 | $297,167 |
| 2019 | $8,014 | $529,711 | $238,370 | $291,341 |
| 2018 | $7,953 | $519,326 | $233,697 | $285,629 |
| 2017 | $7,845 | $509,144 | $229,115 | $280,029 |
| 2016 | $7,466 | $499,162 | $224,623 | $274,539 |
| 2015 | $7,297 | $491,665 | $221,249 | $270,416 |
| 2014 | $6,621 | $482,035 | $216,916 | $265,119 |
Source: Public Records
Map
Nearby Homes
- 503 Chinook Ln
- 444 Roading Dr
- 5776 Arapaho Dr
- 5806 Blossom Ave
- 6057 Pineland Ave
- 721 Shawnee Ln
- 729 Calero Ave
- 405 Don Fernando Way
- 294 Tradewinds Dr Unit 4
- 5508 Sean Cir Unit 107
- 5537 Judith St Unit 1
- 5558 Judith St Unit 1
- 310 Tradewinds Dr Unit 8
- 5577 Spinnaker Dr Unit 4
- 266 Tradewinds Ct Unit 1
- 5477 Entrada Cedros
- 579 Suisse Dr
- 5459 Entrada Cedros
- 5932 Chesbro Ave
- 5504 Don Marcello Ct
- 5819 Snell Ave
- 5807 Snell Ave
- 487 Chinook Ln
- 485 Chinook Ln
- 5825 Snell Ave
- 5801 Snell Ave
- 472 Paiute Ln
- 481 Chinook Ln
- 478 Paiute Ln
- 498 Ariel Dr
- 5831 Snell Ave
- 491 Chinook Ln
- 479 Chinook Ln
- 5799 Hillbright Cir
- 467 Ridgefarm Dr
- 480 Paiute Ln
- 496 Ariel Dr
- 5839 Snell Ave
- 493 Chinook Ln
- 5795 Hillbright Cir
Your Personal Tour Guide
Ask me questions while you tour the home.