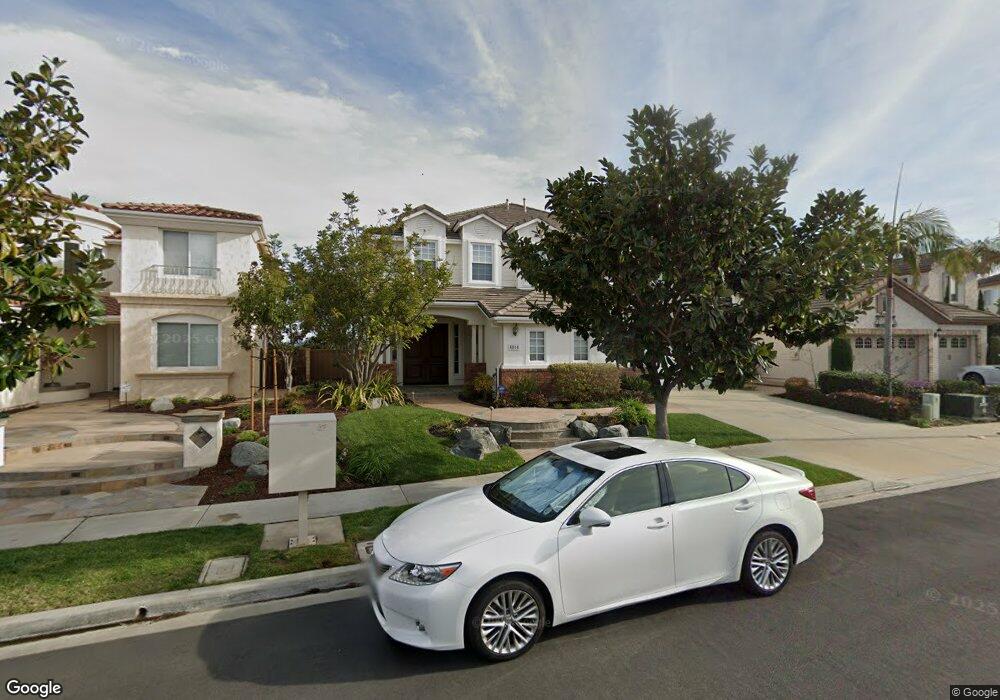
5814 Brittany Forrest Ln Unit 1 San Diego, CA 92130
Carmel Valley NeighborhoodEstimated Value: $3,363,000 - $3,633,000
6
Beds
6
Baths
4,670
Sq Ft
$748/Sq Ft
Est. Value
About This Home
This home is located at 5814 Brittany Forrest Ln Unit 1, San Diego, CA 92130 and is currently estimated at $3,494,307, approximately $748 per square foot. 5814 Brittany Forrest Ln Unit 1 is a home located in San Diego County with nearby schools including Sage Canyon School, Carmel Valley Middle School, and Torrey Pines High School.
Ownership History
Date
Name
Owned For
Owner Type
Purchase Details
Closed on
Oct 13, 2006
Sold by
Moss Ronald B and Moss Brenda I
Bought by
Gb Development Llc
Current Estimated Value
Purchase Details
Closed on
May 24, 2004
Sold by
Moss Ronald B and Moss Brenda I
Bought by
Moss Ronald B and Moss Brenda I
Purchase Details
Closed on
Oct 29, 2003
Sold by
Charles Andrew H and Charles Debra A
Bought by
Moss Ronald B and Moss Brenda I
Home Financials for this Owner
Home Financials are based on the most recent Mortgage that was taken out on this home.
Original Mortgage
$800,000
Interest Rate
4.87%
Mortgage Type
Unknown
Purchase Details
Closed on
Mar 17, 2000
Sold by
Pardee Construction Co
Bought by
Charles Andrew H and Charles Debra A
Home Financials for this Owner
Home Financials are based on the most recent Mortgage that was taken out on this home.
Original Mortgage
$650,000
Interest Rate
7.75%
Create a Home Valuation Report for This Property
The Home Valuation Report is an in-depth analysis detailing your home's value as well as a comparison with similar homes in the area
Home Values in the Area
Average Home Value in this Area
Purchase History
| Date | Buyer | Sale Price | Title Company |
|---|---|---|---|
| Gb Development Llc | -- | United Title Company | |
| Moss Ronald B | -- | -- | |
| Moss Ronald B | $1,310,000 | Fidelity National Title Co | |
| Charles Andrew H | $819,000 | Chicago Title |
Source: Public Records
Mortgage History
| Date | Status | Borrower | Loan Amount |
|---|---|---|---|
| Previous Owner | Moss Ronald B | $800,000 | |
| Previous Owner | Charles Andrew H | $650,000 | |
| Closed | Charles Andrew H | $86,850 | |
| Closed | Moss Ronald B | $348,000 |
Source: Public Records
Tax History Compared to Growth
Tax History
| Year | Tax Paid | Tax Assessment Tax Assessment Total Assessment is a certain percentage of the fair market value that is determined by local assessors to be the total taxable value of land and additions on the property. | Land | Improvement |
|---|---|---|---|---|
| 2025 | $19,975 | $1,781,873 | $870,840 | $911,033 |
| 2024 | $19,975 | $1,746,935 | $853,765 | $893,170 |
| 2023 | $19,738 | $1,712,682 | $837,025 | $875,657 |
| 2022 | $19,445 | $1,679,101 | $820,613 | $858,488 |
| 2021 | $18,782 | $1,646,178 | $804,523 | $841,655 |
| 2020 | $18,875 | $1,629,299 | $796,274 | $833,025 |
| 2019 | $18,531 | $1,597,353 | $780,661 | $816,692 |
| 2018 | $17,772 | $1,566,033 | $765,354 | $800,679 |
| 2017 | $17,463 | $1,535,328 | $750,348 | $784,980 |
| 2016 | $16,926 | $1,505,225 | $735,636 | $769,589 |
| 2015 | $16,693 | $1,482,617 | $724,587 | $758,030 |
| 2014 | $15,792 | $1,400,000 | $683,000 | $717,000 |
Source: Public Records
Map
Nearby Homes
- 10794 Spur Point Ct
- 6286 Belmont Trail Ct
- 5398 Shannon Ridge Ln
- 10941 Derrydown Way Unit 10
- 0 Grand Del Mar Place Unit VU 8-4-5 NDP2502279
- 5255 Greenwillow Ln
- 6370 Carmel View S
- 10553 Gaylemont Ln Unit 5
- 5970 Shaw Lopez Row
- 5171 Del Mar Mesa Rd
- 6718 Indio Way
- 11265 Caminito Aclara
- 11318 Caminito Rodar
- 11324 Caminito Rodar
- 11311 Caminito Rodar
- 11319 Caminito Rodar
- 7220 Calle Cristobal Unit 12
- 5231 Setting Sun Way
- 7349 Calle Cristobal Unit 181
- 7365 Calle Cristobal Unit 197
- 5808 Brittany Forrest Ln
- 5820 Brittany Forrest Ln
- 5802 Brittany Forrest Ln
- 5828 Brittany Forrest Ln
- 5809 Brittany Forrest Ln
- 5786 Brittany Forrest Ln
- 5803 Brittany Forrest Ln
- 5836 Brittany Forrest Ln
- 5780 Brittany Forrest Ln
- 5787 Brittany Forrest Ln Unit 1
- 5844 Brittany Forrest Ln
- 5781 Brittany Forrest Ln
- 5774 Brittany Forrest Ln
- 5775 Brittany Forrest Ln
- 5768 Brittany Forrest Ln
- 5894 Gablewood Way
- 5828 Concord Woods Way
- 5816 Concord Woods Way
- 5769 Brittany Forrest Ln
- 5798 Concord Woods Way